Research Note
What high yield valuations are implying about the forward corporate default rate?
Dear Customers,
Our duty is to keep you updated with the most recent information from our selected Asset Managers regarding their views on current and future market conditions, as well as their current positioning and portfolio activity.
In these difficult period, we will try to communicate as regularly as possible whenever we deem it is relevant and insightful for you and your clients. We strive to be as close to you as possible by giving you this update.
Do let us know should you have any questions, related to those funds or any other in our list.
What is in the price ?
In fast-moving and choppy market environments like today, it can be worthwhile to consider the question: “What’s in the price?” for high yield bonds more particularly.
Price can include compensation for relative liquidity, credit quality changes brought about by both management actions, or the operating environment itself, and of course the default risk. Further, investors sentiment and flows can play a role in driving credit spreads in the short term.
For strategic investors with a long-term mindset, default and recovery estimates are the key considerations in determining appropriate spread levels.
Implied default analysis assuming 5-year term and 30% recovery.
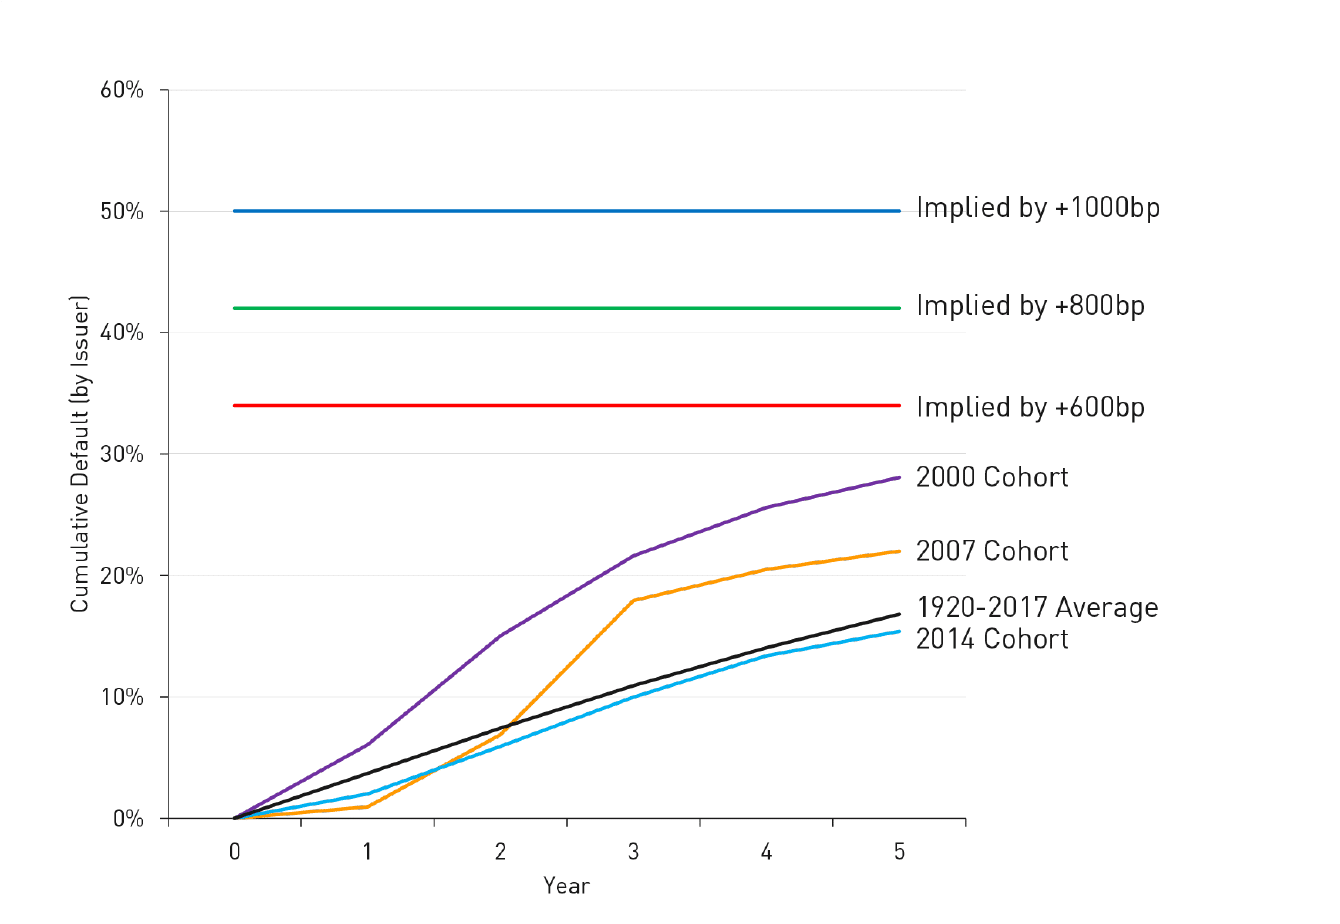
In the chart above, these key variables are addressed by approximating the implied cumulative default of a hypothetical credit portfolio of five-year maturity, assuming a 30% recovery rate. For example, at a spread of 800 bps (green line), the analysis consider this level of credit spreads as “fair value”, should 42% of the issuers default over five years in an hypothetical credit portfolio.
- 2000 : This cohort’s default experience resulted from the leverage built up in credit markets leading to Y2K, the tech bubble, outsized capital spending in the telecommunications sector, and the ultimate failure bourn of accounting scandals at WorldCom and Enron. Notably, this is the most severe of the three cycles, actually worse than the cumulative corporate default experienced around the Global Financial Crisis.
- 2007 : This cohort’s defaults were again driven by corporate leverage built up pre-crisis from the climb in leveraged buyout (LBO) activity, outsized corporate spending, debt financed share buybacks and the financial crisis that resulted from the troubles in the global banking system, U.S. sub-prime housing markets, and with leveraged consumer balance sheets.
- 2014 : This cohort’s defaults were driven by leverage that largely built up in a few specific sectors, namely: energy, mining and to a lesser extent, retail. To note that the cumulative default experience in the five years that followed was not all that far off from the average default experience seen over five-year periods using data from 1920. No recession ensued as the credit damage was largely contained to a small segment of the economy.
At prevailing credit spreads, investors are bracing for almost twice the cumulative corporate default experience that eventually occurred around the Global Financial Crisis.
Of course, every cycle can be different, but it’s always important to calibrate what the market is already priced for and consider if that outcome should be a base case assumption about the picture.
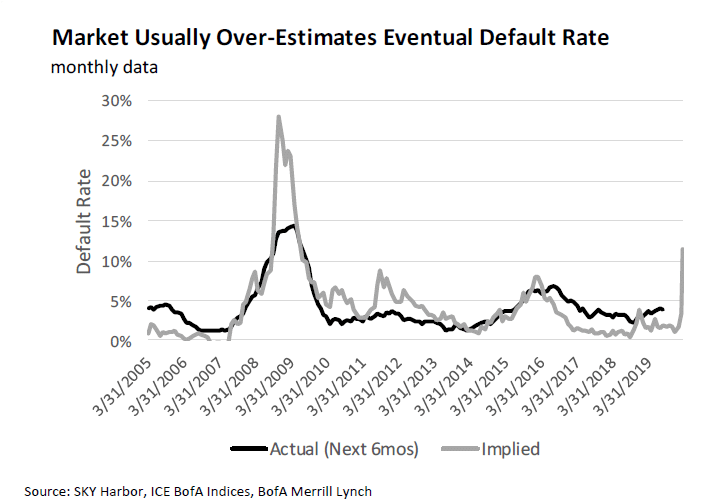
Historical performance
Over the long run, OAS-implied default rates have been relatively consistent with actual defaults six months into the future. This dynamic, however, tends to break down in periods of stress. As demonstrated below, the market typically overestimates the underlying risk of default by a factor of 1.5x when spreads are above 600 bps.
Have we hit a spread peak?
We do not know, and every cycle is different. Much of the market’s reactions around 2008 were about systemic counterparty and banking system issues, not corporate credit, but what we can observe is that US high yield index spreads breaching 900 bps have in the past marked pivotal moments for risk-taking, with strong returns following even if 900 bps is well below ultimate peak levels.
For example, US High Yield spreads breached 900 bps on September 16, 2008 for the first time since recovering from the early 2000’s recession. Spreads would continue to widen from the 900bps points level before hitting a peak on December 15, 2008 (at 2,147 bps) and remained above 1,000 bps until July 31, 2009. However, an investment in the high yield index at the time of crossing (September 16, 2008) would have led to annualized returns over the next 12-, 24- and 36-month periods of 12.8%, 16.0% and 12.5%, respectively.
High Yield Index composition
We can expect a significant shake-up in the high yield composition in the next few months, particularly with regards to the sector allocation. At current oil price there are large crossover Energy companies at risk to be downgraded very soon to a below-investment grade rating.
This can lead to an increase of the energy weighting of up to 40% of the US high yield index (currently 14%). Although this scenario looks extreme, an increase to 25% or 30% is more likely, and would significantly impact the behaviour of the asset class.
In that context we would suggest being very cautious with passive strategies, which will involve passive allocation towards risks not only from the COVID turmoil, but also from the oil price.
.. get also our latest managers comments
5 fund managers who delivered alpha
Their latest comments and positioning
Contact us to request a copy