Portfolios of Active Funds
WSP Model Portfolios are built from our universe of selected active Ucits funds and we mange actively the allocation according to current and expected market conditions and the fund managers’ exposure.
The aim is to demonstrate that an optimal combination of strategies, coupled with a careful selection of active fund managers, have the ability to deliver added-value over the long run while keeping a full exposure and constant asset allocation within the given investment profiles.
More detailed reporting including portfolio quantitative and qualitative data are available to customers having subscribed to the WS Partners Model Portfolio Services. Would you request more information on this service, please do not hesitate to contact us.
Key Characteristics
Portfolios Structure
- Portfolios are made up of 14 to 17 Ucits or Alternative Ucits funds (according to profile).
- We have started two currency based family of portfolios ; in US dollar and in Euro.
- Apart one fund, with a bi-monthly liquidity, all funds have a daily liquidity.
- Usually we select the same funds for the USD or the EUR based portfolios, with hedged currency exposure for fixed income funds.
- The performances are shown net of fees, calculated on the cheapest share classes, and making our Model Portfolios fully replicable.
Strategic Allocations
We keep a constant balance between equity and fixed income strategies according to Model Portfolio profiles and guidelines. We also maintain a neutral currency and regional allocation compare to benchmarks.
The portfolio outperformance should mainly arise from the alpha generated by active management. Tactical bets such as investment style (value, growth defensive), sector allocation (e.g., commodities, real estate), interest rate or spread duration might also contribute, time to time, to the value added generation.
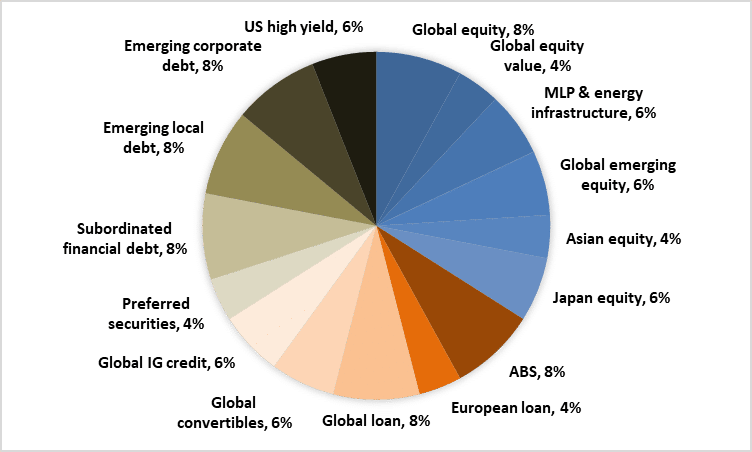
Yield & Income Portfolio
A conservative portfolio with a 1/3 equity and 2/3 fixed income allocation.
Within the equity universe we tend to favour yielding strategies rather than pure price appreciation funds.
The objective is to outperform over time a benchmark composed by 1/3 of the MSCI All Country World Index, and by 2/3 of the Barclays Global Aggregate Bond Index.
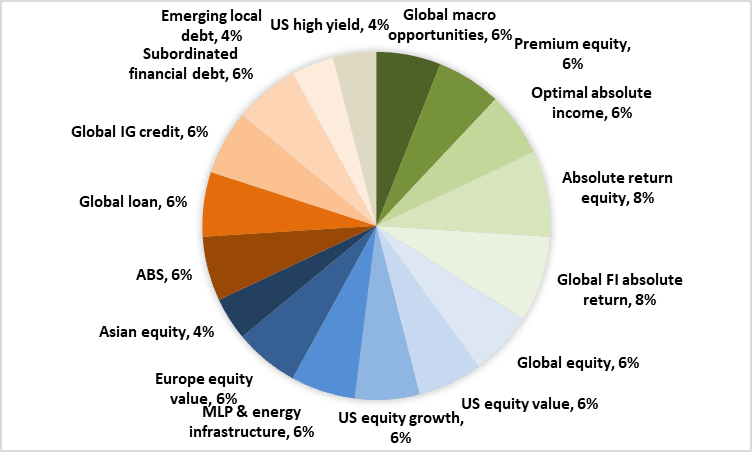
Balanced Portfolio
The portfolio aims to outperform a benchmark made of 50% MSCI All Country World Index, and 50% Barclays Global Aggregate Bond Index in a risk-adjusted return basis and with a capital preservation mindset.
For that reason, we maintain around 33% of the portfolio allocation into Absolute Return strategies, including Alternative Ucits funds.
Growth Portfolio
The most equity oriented portfolio with the aim to beat a benchmark composed by 2/3 of the MSCI All Country World Index and 1/3 of the Barclays Global Aggregate Bond Index. Growth of capital through capital appreciation is the main long term portfolio objective.
Review and Outlook – Year 2017
December tops off what has been in many respects an extraordinary year on the stock exchanges, once again delivering record highs among US equities and a mixed picture among the European share indices. Records were broken not only among the equities but also in the case of the implicit volatilities – for example, the VIX fell at times to a record low of 8.56. The spread between the interest rates in Europe and the USA has also reached an extreme level, with a difference of almost 2%. Another notable feature is the longest winning streak on the S&P500. The index closed higher for nine months in a row.
In equity the leading position of the US markets was up again with widespread gains in the USA (+1.1% S&P500), whereas the European markets slightly underperformed (+0.8% MSCI Europe) which consolidated the outperformance of the US equity market in 2017 (+21.8% vs. 10.2%). In addition to the leading technology heavyweights, key drivers for the relative outperformance by the US markets includes the weak USD. The emerging markets also shone, making good headway throughout the year (+37.3%), including in December (+3.6%).
The 10-year interest rates rose slightly in the USA in December. For the full year, however, there were hardly any significant changes in 10-year yields on the main interest rate markets. The changes in yield in the two-year sector have been much more highly accentuated, which has led to a serious flattening of the interest rate curve this year. There were significant falls in yield among the ten-year maturities for risky government such as the Greek, Portuguese or Argentinian bonds.
Finally, the US dollar index continued to lose value in December, extending its losses for the year to around 9.9%. There were no significant changes in December for the Swiss franc in relation to the USD or the EUR. However, for the year the Swiss franc is taking a break, losing more than 9% against the EUR and getting close to the exchange rate floor of 1.20 per EUR.
Outlook
No change in the portfolio in December, neither in the fund selection, nor in the portfolio construction.
We keep our risk-on mood which is expressed through:
- An overweight in spread duration for all profile
- An overweight in emerging markets, both equities and FI
- A value-style bias for the Growth and Balanced portfolios.
For 2018 we expect increasing volatility in the markets along with accelerating style rotation in equities. We will monitor closely how the monetary policies will impact the markets and trim our risk-on positioning during the year to a more neutral stance.
Performance Review – December 2017
The MSCI ACWI (USD) had a performance of +1.6% during the month while the Barclays Global Aggregate index (USD hedged) returned +0.2%. In 2017 they return respectively +24% and +3.0%.
In December, active management performance was mixed with 11 of the 26 funds we have in all Model Portfolios, showing excess return.
In absolute terms, the Growth portfolio recorded the best performance with +1.6% ahead of the Yield & Income portfolio at +1.1% and the Balanced AR portfolio at +0.7%.
Yield & Income Portfolio (USD)
The portfolio outperformed its benchmark by +44bps in December. While the strategy benefited mainly from its Emerging Markets exposure, both in equity and debt, the contribution of active management was neutral to slightly negative at -4bps.
Year 2017
Over the last year, the portfolio had a performance of +12.5%, outperforming its reference index by +309bps. We are pleased to notice that the excess return is almost exclusively explained by the contribution of the active management (305bps). Over the year only 3 out of 16 funds were underperforming. Being long spread duration has also contributed strongly to the performance. Our best performer in 2017 has been our Emerging Market equity fund which has largely outperformed its benchmark by more than +1’000bps (47.9% vs. 37.3%). On the other hand, the exposure to the MLP and energy infrastructure sector has been detractor (-130bps).
Balanced Portfolio (USD)
The portfolio underperformed by 22bps in December, penalized, as it has been the case all over the year, by its absolute return pocket (1/3 of the portfolio) unwilling to match the strength of the equity market. Moreover, active management has been a detractor (-29bps).
Year 2017
In 2017 the portfolio is in line with its benchmark (12.4% vs. 12.8%). As previously said, the absolute return exposure has been the main drag in alpha creation against a benchmark equally made of the MSCI World AC index and the BarCap Global Agg. This absolute return allocation aims to protect the capital during turbulent periods as defined in the objective of the strategy. We are however pleased to see the portfolio almost fully participated to the market rally thanks to the active management selection which accounts +411bps to the performance. Among the 17 funds in the portfolio, 14 showed excess returns. With regard to our exposure by manager, the US equity fund has been the best relative performer by adding almost +1’000bps (31.4% vs. 21.1%) of alpha, while the MLP fund worsened the performance by -90bps.
Growth Portfolio
The strategy finished the year strongly with +1.6% for the month, outperforming its index by +50bps. Active management contributed for +27bps and value funds were among the best performers in this end of the year rally.
Year 2017
At year-end the portfolio exhibits a performance of +19.5%, ahead of its benchmark by +308bps. While our value bias produced mixed results despite the year-end rally, the active management (+364bps) more than compensated our style bias. 12 of our 14 active fund managers have been able to generate excess return in 2017. The best relative performer has been a European equity fund generating +1’060bps of outperformance while our Japanese equity fund has been our worst relative exposure (-256bps).
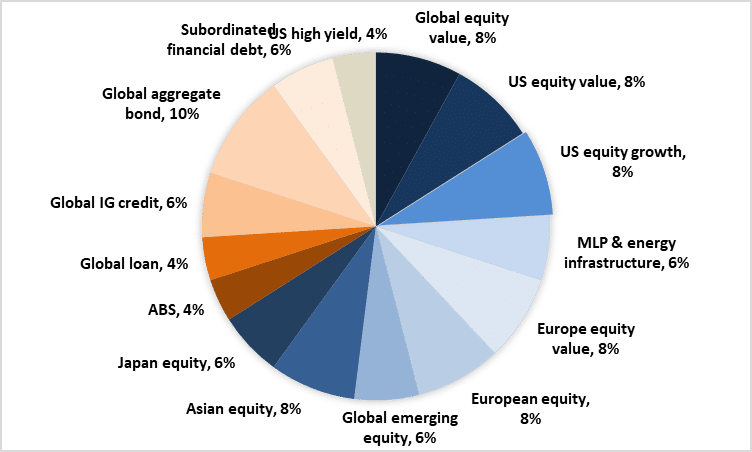
Allocation by funds’ strategy
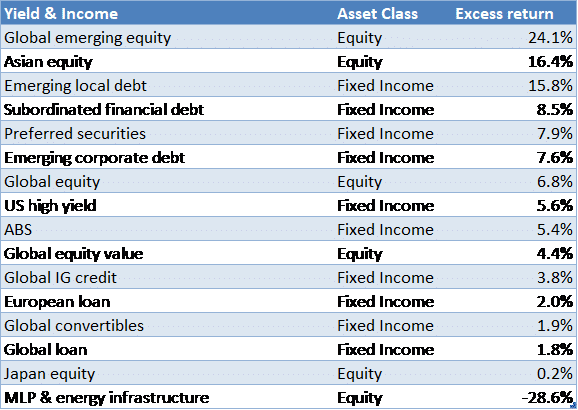
Excess returns by funds’ strategy
Allocation by funds’ strategy
Excess returns by funds’ strategy
Allocation by funds’ strategy
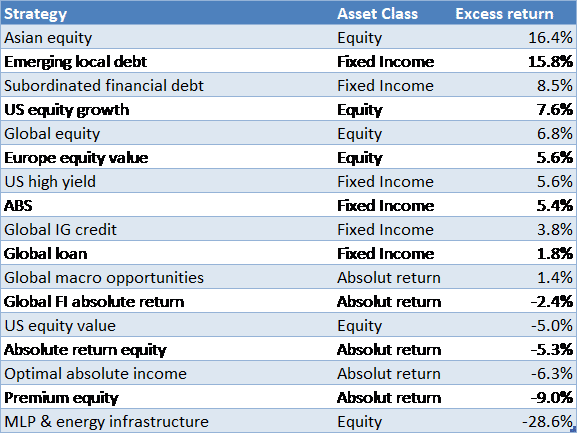
Excess returns by funds’ strategy
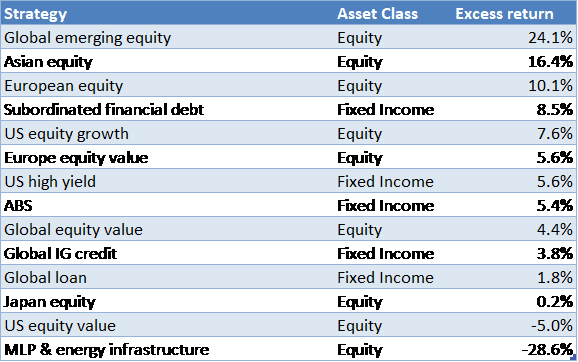
Source: WS Partners, Morningstar Direct,
Excess return is calculated against the respective asset class benchmark; MSCI World AC in USD for Equity, BarCap Global Agg USD for Fixed Income.
As per 31.12.2017
US Dollar Portfolios
US Dollar - Yield and Income
Cumulative Performance to end 12 2017
Calendar Returns
| Jan | Feb | Mar | Apr | May | Jun | Jul | Aug | Sep | Oct | Nov | Dec | YTD | ||
|---|---|---|---|---|---|---|---|---|---|---|---|---|---|---|
| Portfolio | 2017 | 2.15% | 1.58% | 0.72% | 1.01% | 1.27% | 0.19% | 1.55% | 0.03% | 0.58% | 1.05% | 0.61% | 1.07% | 12.45% |
| Benchmark | 0.68% | 1.49% | 0.35% | 0.95% | 1.10% | -0.06% | 1.13% | 0.71% | 0.32% | 0.95% | 0.73% | 0.63% | 9.36% | |
| Portfolio | 2016 | 1.16% | 2.25% | 1.04% | 0.86% | -0.43% | -1.25% | 1.25% | 4.93% | |||||
| Benchmark | 1.04% | 1.81% | 0.06% | 0.17% | -1.23% | -0.86% | 0.84% | 1.81% |
Benchmark: 1/3 MSCI All Country World + 2/3 Barclays Gbl Agg
Source: WS Partners, Morningstar
US Dollar - Balanced
Cumulative Performance to end 12 2017
Calendar Returns
| Jan | Feb | Mar | Apr | May | Jun | Jul | Aug | Sep | Oct | Nov | Dec | YTD | ||
|---|---|---|---|---|---|---|---|---|---|---|---|---|---|---|
| Portfolio | 2017 | 1.85% | 1.21% | 0.74% | 0.84% | 0.87% | 0.64% | 1.73% | 0.04% | 1.19% | 1.03% | 0.93% | 0.66% | 12.35% |
| Benchmark | 1.19% | 1.82% | 0.56% | 1.10% | 1.37% | 0.07% | 1.54% | 0.63% | 0.72% | 1.23% | 1.02% | 0.88% | 12.82% | |
| Portfolio | 2016 | 0.01% | 2.83% | 0.94% | 0.65% | -0.55% | 0.36% | 1.59% | 5.93% | |||||
| Benchmark | 0.62% | 2.43% | 0.12% | 0.28% | -1.35% | -0.46% | 1.17% | 2.81% |
Benchmark: 1/2 MSCI All Country World + 1/2 Barclays Gbl Agg
Source: WS Partners, Morningstar
US Dollar - Growth
Calendar Returns
| Jan | Feb | Mar | Apr | May | Jun | Jul | Aug | Sep | Oct | Nov | Dec | YTD | ||
|---|---|---|---|---|---|---|---|---|---|---|---|---|---|---|
| Portfolio | 2017 | 2.83% | 1.52% | 1.28% | 1.65% | 1.88% | 0.46% | 2.48% | -0.28% | 1.77% | 1.52% | 1.22% | 1.62% | 19.45% |
| Benchmark | 1.70% | 2.14% | 0.78% | 1.25% | 1.65% | 0.19% | 1.95% | 0.54% | 1.12% | 1.51% | 1.32% | 1.12% | 16.37% | |
| Portfolio | 2016 | -1.01% | 4.18% | 1.46% | 1.17% | -1.04% | 0.28% | 1.33% | 6.44% | |||||
| Benchmark | 0.21% | 3.05% | 0.19% | 0.39% | -1.47% | -0.06% | 1.50% | 3.80% |
Benchmark: 2/3 MSCI All Country World + 1/3 Barclays Gbl Agg
Source: WS Partners, Morningstar
Euro Portfolios
Euro - Yield and Income
Cumulative Performance to end 12 2017
Calendar Returns
| Jan | Feb | Mar | Apr | May | Jun | Jul | Aug | Sep | Oct | Nov | Dec | YTD | ||
|---|---|---|---|---|---|---|---|---|---|---|---|---|---|---|
| Portfolio | 2017 | 1.24% | 2.08% | 0.35% | 0.20% | 0.10% | -0.38% | 0.23% | -0.41% | 0.61% | 1.46% | -0.20% | 0.56% | 5.97% |
| Benchmark | -0.24% | 2.01% | 0.03% | 0.26% | -0.09% | -0.64% | -0.11% | 0.31% | 0.41% | 1.35% | -0.17% | 0.26% | 3.39% | |
| Portfolio | 2016 | 1.12% | 2.05% | 1.00% | 0.53% | 0.20% | -0.23% | 1.34% | 6.16% | |||||
| Benchmark | 1.03% | 1.51% | 0.11% | -0.22% | -0.52% | 0.14% | 0.92% | 3.00% |
Benchmark: 1/3 MSCI All Country World + 2/3 Barclays Gbl Agg
Source: WS Partners, Morningstar
Euro - Balanced
Cumulative Performance to end 12 2017
Calendar Returns
| Jan | Feb | Mar | Apr | May | Jun | Jul | Aug | Sep | Oct | Nov | Dec | YTD | ||
|---|---|---|---|---|---|---|---|---|---|---|---|---|---|---|
| Portfolio | 2017 | 0.67% | 1.98% | 0.39% | -0.11% | -0.71% | -0.09% | 0.02% | -0.47% | 1.34% | 1.57% | -0.12% | 0.19% | 4.72% |
| Benchmark | -0.12% | 2.65% | 0.16% | 0.13% | -0.33% | -0.72% | -0.22% | 0.12% | 0.93% | 1.91% | -0.23% | 0.41% | 4.72% | |
| Portfolio | 2016 | 0.25% | 2.48% | 1.02% | 0.24% | 0.35% | 1.68% | 1.74% | 8.00% | |||||
| Benchmark | 0.67% | 2.03% | 0.27% | -0.24% | -0.20% | 1.13% | 1.38% | 5.13% |
Benchmark: 1/2 MSCI All Country World + 1/2 Barclays Gbl Agg
Source: WS Partners, Morningstar
Euro - Growth
Cumulative Performance to end12 2017
Calendar Returns
| Jan | Feb | Mar | Apr | May | Jun | Jul | Aug | Sep | Oct | Nov | Dec | YTD | ||
|---|---|---|---|---|---|---|---|---|---|---|---|---|---|---|
| Portfolio | 2017 | 1.24% | 2.58% | 0.76% | 0.29% | -0.22% | -0.54% | 0.21% | -0.93% | 2.03% | 2.44% | -0.28% | 0.97% | 8.82% |
| Benchmark | 0.00% | 3.28% | 0.29% | 0.00% | -0.56% | -0.81% | -0.34% | -0.08% | 1.45% | 2.46% | -0.29% | 0.57% | 6.05% | |
| Portfolio | 2016 | -0.95% | 3.88% | 1.55% | 0.66% | 0.46% | 2.35% | 1.69% | 9.98% | |||||
| Benchmark | 0.31% | 2.56% | 0.42% | -0.26% | 0.12% | 2.13% | 1.83% | 7.28% |
Benchmark: 2/3 MSCI All Country World + 1/3 Barclays Gbl Agg
Source: WS Partners, Morningstar