Active Funds in Model Portfolios
WSP Model Portfolios are built from our universe of selected active Ucits funds and the allocation is actively managed by us according to current and expected market conditions and fund manager exposures.
The aim is to demonstrate, through an optimal combination of strategies, that carefully selected active fund managers have the ability to deliver added-value over the long run while keeping a full exposure and constant asset allocation within the following risk-profiles.
More detailed reporting including portfolio quantitative and qualitative data are available to customers having subscribed to the WS Partners Model Portfolio Services. Would you request more information on this service, please do not hesitate to contact us.
Key Characteristics
Portfolios Structure
- Portfolios are made up of 14 to 17 Ucits or Alternative Ucits funds (according to profile).
- We have two currencies base family of portfolios ; in US dollar and in Euro. Swiss Francs will follow shortly
- Apart one fund having a bi-monthly liquidity, all selected funds have a daily liquidity.
- Usually we select the same funds for USD or EUR portfolios, unhedged for equity strategies and hedged for fixed income ones.
- The performances are shown net of fees, using the institutional share classes, making these Model Portfolios fully replicable.
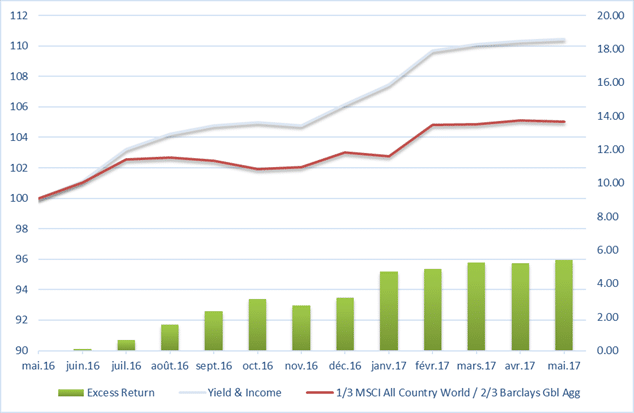
Yield & Income Portfolio
A conservative portfolio with a 1/3 equity and 2/3 fixed income allocation.
Within the equity universe we tend to favour yielding strategies rather than pure price appreciation funds.
The objective is to outperform over time a benchmark composed by 1/3 of the MSCI All Country World Index, and by 2/3 of the Barclays Global Aggregate Bond Index.
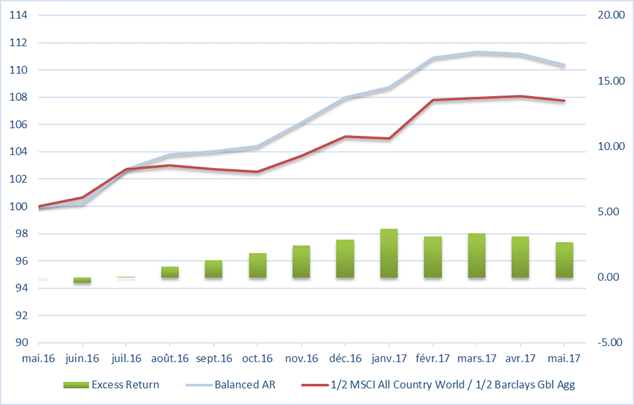
Balanced Portfolio
The portfolio aims to outperform a benchmark made of 50% MSCI All Country World Index, and 50% Barclays Global Aggregate Bond Index in a risk-adjusted return basis and with a capital preservation mindset.
For that reason, the portfolio can be invested up to 33% in Absolute Return strategies, including Alternative Ucits funds.
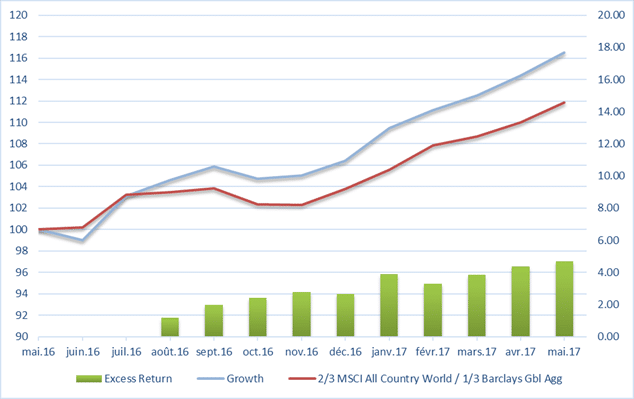
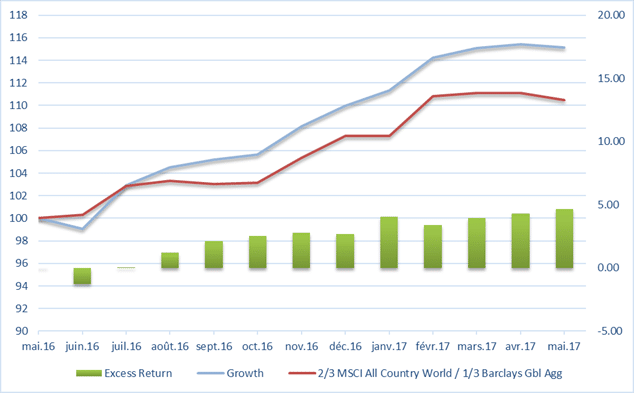
Growth Portfolio
The most equity oriented portfolio with an objective to beat a benchmark composed by 2/3 of the MSCI All Country World Index and 1/3 of the Barclays Global Aggregate Bond Index. Growth of capital through capital appreciation is the main long term portfolio objective.
Review and Outlook – May 2017
Allocations
As mentioned above, we keep a constant balance between equity and fixed income strategies according to the Model Portfolios profiles and guidelines. We also maintain a neutral currency and regional allocation versus benchmarks.
Portfolios outperformance should mainly arise from the alpha generated by the active management. Tactical bets such as investment style (value, growth defensive), sector allocation (e.g., commodities, real estate), interest or spread duration might also contribute time to time to the value added generation.
In Fixed Income, we introduced a Subordinated Financials strategy for all the portfolios at the end of April and we reduced our exposure to more traditional Credit Corporate strategies (Investment Grade and High Yield). While political uncertainties in Europe are somewhat receding after the French election, we think Subordinated Financials continue to offer the best risk/reward opportunities within the Fixed Income Credit space.
Since inception, the three Portfolio Models continue to be comfortably above their respective benchmark. While the excess return of the PM Balanced is somewhat stagnating during the last 3 months for the reason explained below, we are pleased to see that most of the outperformance generated since inception comes from active management and from the skill of our selected Portfolio Managers.
Performance Review
In May, the Yield & Income portfolios, as well as the Growth Portfolios continue to deliver positive alpha, while the Balanced Portfolios lagged their benchmarks due to the absolute return components, and in European equity. However, the three Model Portfolios continue to be comfortably above their respective benchmark and active management remains the main contributor to outperformance
Among the 28 funds we have in the different Model Portfolios, 16 funds had an excess return versus their respective benchmarks.
May was another positive month across the board in the fixed income space. Despite the ‘risk-on’ investors’ mood, US Treasury yields made fresh lows (below 2.2% for the 10y-benchmark) and the curve continues its flattening. Except for Japanese and German governments bonds, all major bond markets printed positive returns. In the Eurozone, the French election outcome benefited mostly to France, Italy and Spain government bonds.
In the credit space, Corporate bonds had also a good month on the back of tighter spreads – 5bps on average, both for IG & HY bonds.
On the equity side, global stocks rose amid signs of improving economic growth and healthy corporate earnings. Several key indices hit record highs as pro-European Union candidate Emmanuel Macron won the French presidential election.
Change in portfolios: We didn’t implement any changes in the portfolios in May.
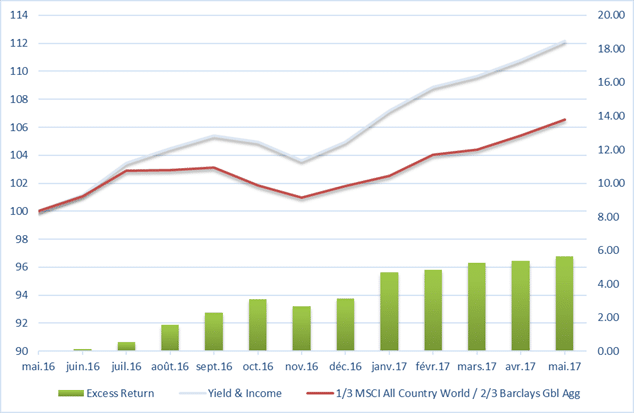
Yield & Income Portfolio
The portfolio outperformed its benchmark by 17bps (+1.27% vs +1.10%).
In Fixed Income, the portfolio benefited from its exposure to Local Currency Emerging Markets as well as its overweight in Subordinated Financials well supported on the back of the French election.
On the equity side, as it happened already in April, the defensive growth strategies contributed again to performance while our holding in the MLP Energy sector proved to be the main detractor from performance following the weakness in oil price.
Finally, active management was a positive factor: out of 14 funds in the portfolio, only 5 were behind their benchmarks and contributed on average to 12bps of outperformance.
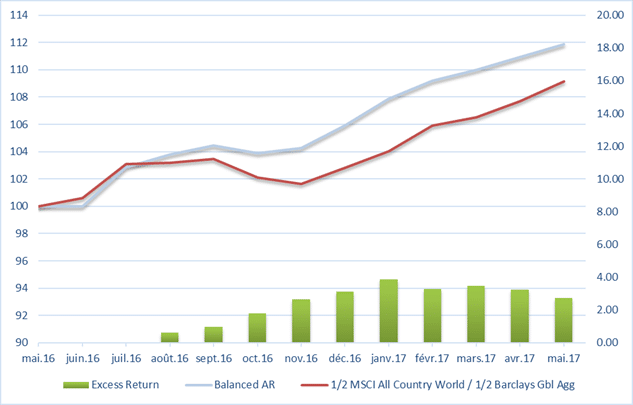
Balanced Portfolio
As a reminder, by adding 1/3 of the portfolio in Absolute Return strategies in the Balanced portfolio, we took the bet to outperform over time a classic 50% Equity – 50% Fixed Income benchmark by maintaining a portfolio with same expected return but with lower volatility and a capital preservation mindset.
In absolute terms the portfolio recorded a positive performance of +0.87% for the month (in USD) vs a benchmark adding + 1.37%.
The Balanced Portfolio lagged by 50bps during the month mainly due to the Absolute Return pocket which was unsurprisingly costly in a risk-on environment. Overall, active management was a negative factor during the month. Main reason for that was the value style bias of the portfolio.
Out of 17 funds 9 were below their benchmark, with a negative effect of 22bps on average to the portfolio.
Growth Portfolio
The Growth portfolio beat its benchmark by 23bps in May.
While the value tilt was also a negative contributor, it was more than compensated by the excess return generated by the active management.
Only 5 funds were behind their index and 9 had a positive contribution.
On average, the Portfolio Managers generated 10bps to the Portfolio Model.
Outlook
We still keep our risk-on mood which are expressed through:
- An overweight in spread duration for all profile
- A slight Overweight Emerging Markets both FI and Equities
- A value bias for the Growth and Balanced portfolios
US Dollar Portfolios
US Dollar – Yield and Income Portfolio
Cumulative Performance since 30.5.2016
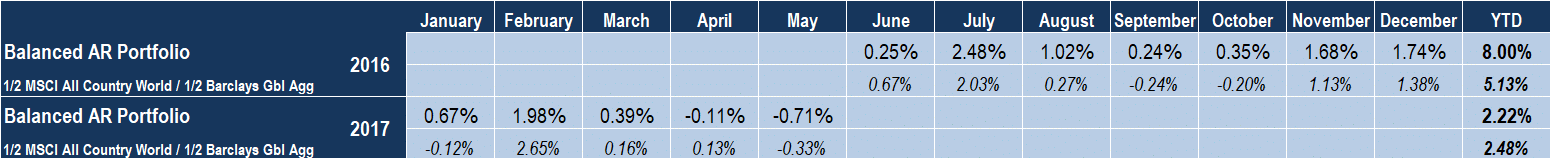
Calendar Returns
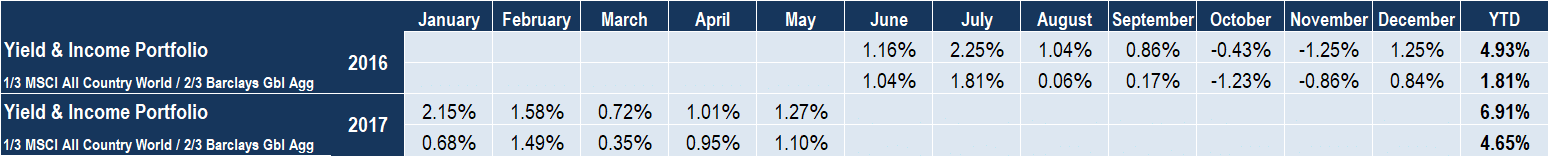
Source: WS Partners, Morningstar
US Dollar – Balanced Portfolio
Cumulative Performance since 30.5.2016
Calendar Returns
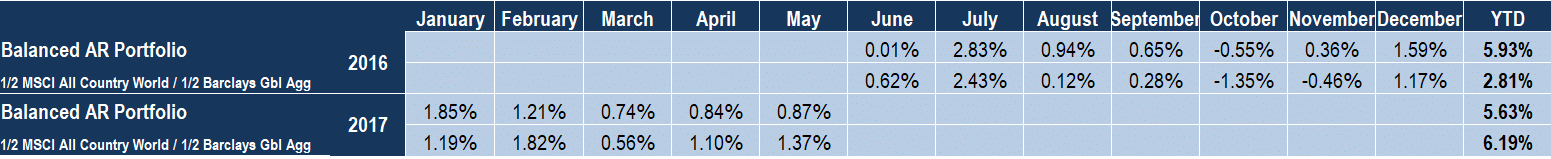
Source: WS Partners, Morningstar
US Dollar – Growth Portfolio
Cumulative Performance since 30.5.2016
Calendar Returns

Source: WS Partners, Morningstar
Euro Portfolios
Euro – Yield and Income Portfolio
Cumulative Performance since 30.5.2016
Calendar Returns

Source: WS Partners, Morningstar
Euro – Balanced Portfolio
Cumulative Performance since 30.5.2016
Calendar Returns
Source: WS Partners, Morningstar
Euro- Growth Portfolio
Cumulative Performance since 30.5.2016
Calendar Returns

Source: WS Partners, Morningstar
Disclaimer: Past performance is not indicative of future results. Any references to expected or target returns reflect third-party views or historical context and do not constitute investment advice or a guarantee of future performance.