Active Funds in Model Portfolios
WSP Model Portfolios are built from our universe of selected active Ucits funds and the allocation is actively managed by us according to current and expected market conditions and fund manager exposures.
The aim is to demonstrate, through an optimal combination of strategies, that carefully selected active fund managers have the ability to deliver added-value over the long run while keeping a full exposure and constant asset allocation within the following risk-profiles.
More detailed reporting including portfolio quantitative and qualitative data are available to customers having subscribed to the WS Partners Model Portfolio Services. Would you request more information on this service, please do not hesitate to contact us.
Key Characteristics
Portfolios Structure
- Portfolios are made up of 14 to 17 Ucits or Alternative Ucits funds (according to profile).
- We have started two currency based family of portfolios ; in US dollar and in Euro. Swiss Francs will follow shortly
- Apart one fund with a bi-monthly liquidity, all funds have a daily liquidity.
- Usually we select the same funds for USD or EUR portfolios, unhedged for equity strategies and hedged for fixed income ones.
- The performances are shown net of fees, using the institutional share classes, making these Model Portfolios fully replicable.
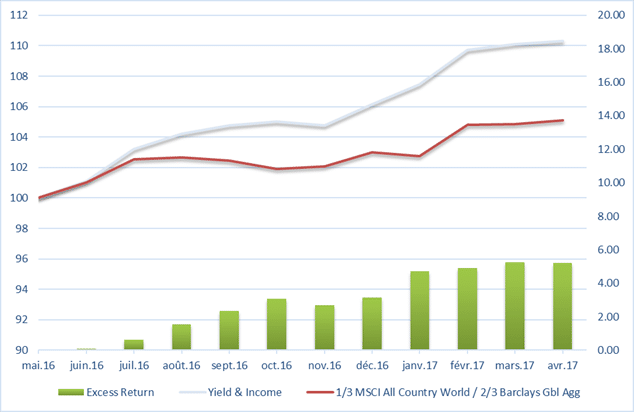
Yield & Income Portfolio
A conservative portfolio with a 1/3 equity and 2/3 fixed income allocation.
Within the equity universe we tend to favour yielding strategies rather than pure price appreciation funds.
The objective is to outperform over time a benchmark composed by 1/3 of the MSCI All Country World Index, and by 2/3 of the Barclays Global Aggregate Bond Index.
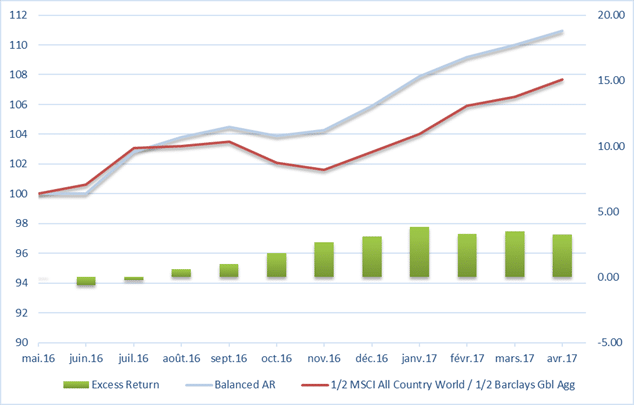
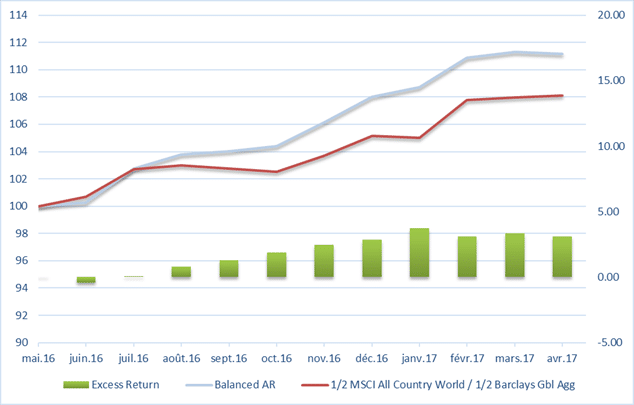
Balanced Portfolio
The portfolio aims to outperform a benchmark made of 50% MSCI All Country World Index, and 50% Barclays Global Aggregate Bond Index in a risk-adjusted return basis and with a capital preservation mindset.
For that reason, the portfolio can be invested up to 33% in Absolute Return strategies, including Alternative Ucits funds.
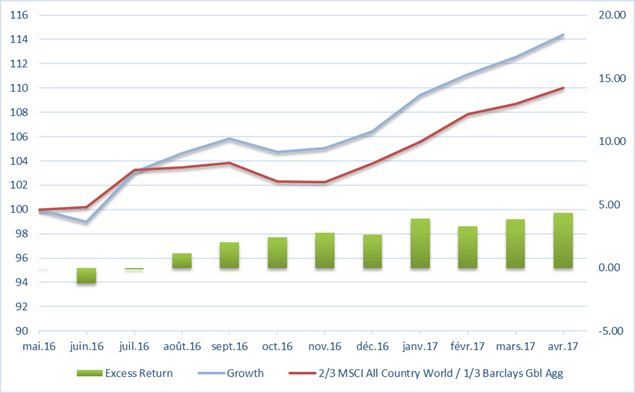
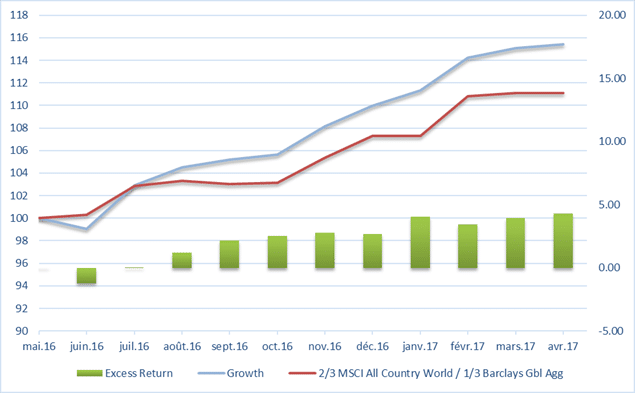
Growth Portfolio
The most equity oriented portfolio with an objective to beat a benchmark composed by 2/3 of the MSCI All Country World Index and 1/3 of the Barclays Global Aggregate Bond Index. Growth of capital through capital appreciation is the main long term portfolio objective.
Review and Outlook – April 2017
Allocations
As mentioned above, we keep a constant balance between equity and fixed income strategies according to the Model Portfolios profiles and guidelines. We also maintain a neutral currency and regional allocation versus benchmarks.
Portfolios outperformance should mainly arise from the alpha generated by the active management. Tactical bets such as investment style (value, growth defensive), sector allocation (e.g., commodities, real estate), interest or spread duration might also contribute time to time to the value added generation.
In Fixed Income, we introduced a Subordinated Financials strategy for all the portfolios at the end of the month and we reduced our exposure to more traditional Credit Corporate strategies (Investment Grade and High Yield). While political uncertainties in Europe are somewhat receding after the French election, we think Subordinated Financials continue to offer the best risk/reward opportunities within the Fixed Income Credit space.
Since inception, the three Portfolio Models continue to be comfortably above their respective benchmark. While the excess return of the PM Balanced is somewhat stagnating during the last 3 months for the reason explained below, we are pleased to see that most of the outperformance generated since inception comes from active management and from the skill of our selected Portfolio Managers.
Performance Review
We are pleased to observe that most of our outperformance came from the alpha generated by the selected asset managers.
Among the 27 funds we have in the different Model Portfolios, 16 funds had an excess return versus their respective benchmarks.
The Fixed Income and Equity Market were positively oriented again in April. Most of the Fixed Income asset classes benefited from a decreasing interest rate environment as well as spreads tightening. In Equity, the MSCI All Country World gained 1.55% during the month. Year-to-Date, the equity index is now up by 8.5% and the Barclays Global Aggregate added 1.1%. Our Portfolio Models recorded mixed results in April.
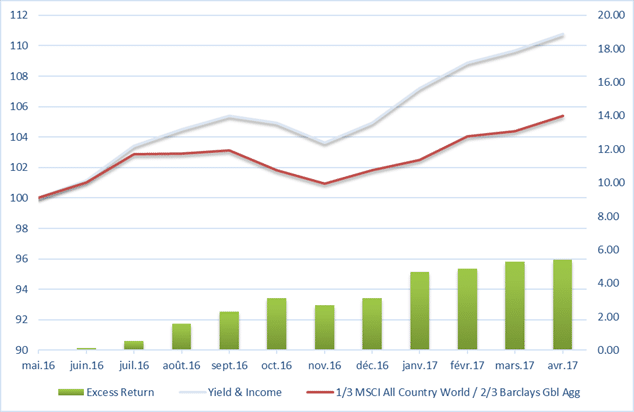
Yield & Income Portfolio
The portfolio slightly outperformed its benchmark by 6bps (+1.01% vs +0.95%).
The portfolio benefited from its exposure to spread sensitive strategies like High Yield, Convertible Bonds and Preferred Securities. The defensive growth strategies in equities were also contributors to the performance.
On the other hand, our position in the MLP Energy sector was the main detractor in April.
Finally, active management generated added-value. Out of 14 funds in the portfolio, only 4 were behind their benchmarks and contributed on average to 24bps of outperformance.
Balanced Portfolio
As a reminder, by adding 1/3 of the portfolio in Absolute Return strategies in the Balanced portfolio, we took the bet to outperform over time a classic 50% Equity – 50% Fixed Income benchmark with lower volatility and a capital preservation mindset.
The Balanced Portfolio lagged by 26bps during the month mainly due to its Absolute Return pocket. This pocket serves as an insurance premium and should help us during weak market conditions. We have therefore not been surprised to see this premium to be a lagging factor in a month during which every risky assets were rewarded.
On the other hand, active management has had a positive effect. Out of 17 funds, 12 were above their benchmarks, contributing on average to 11bps to the portfolio, and in absolute terms the portfolio recorded a positive performance of +0.84% for the month.
Growth Portfolio
The Growth portfolio beat its benchmark by 40bps in April.
Most of this outperformance is coming from the excess return generated by active managers. Only 3 funds were behind their index and 11 had a positive contribution.
On average the Portfolio Managers generated 43bps to the Portfolio Model. The Value equity bias we introduced in the portfolio since inception was detractor in April but it was compensated by the spread duration in the Fixed Income section.
Outlook
Going forward we keep our risk-on mood which are expressed through:
- An overweight in spread duration for all profile
- A slight Overweight Emerging Markets both FI and Equities
- A value bias for the Growth and Balanced portfolios
US Dollar Portfolios
US Dollar – Yield and Income Portfolio
Cumulative Performance since 30.5.2016
Calendar Returns

Source: WS Partners, Morningstar
US Dollar – Balanced Portfolio
Cumulative Performance since 30.5.2016
Calendar Returns

Source: WS Partners, Morningstar
US Dollar – Growth Portfolio
Cumulative Performance since 30.5.2016
Calendar Returns

Source: WS Partners, Morningstar
Euro Portfolios
Euro – Yield and Income Portfolio
Cumulative Performance since 30.5.2016
Calendar Returns

Source: WS Partners, Morningstar
Euro – Balanced Portfolio
Cumulative Performance since 30.5.2016
Calendar Returns

Source: WS Partners, Morningstar
Euro- Growth Portfolio
Cumulative Performance since 30.5.2016
Calendar Returns
