Portfolios of Active Funds
WSP Model Portfolios are built from our universe of selected active Ucits funds and the allocation is actively managed by us according to current and expected market conditions and fund manager exposures.
The aim is to demonstrate, through an optimal combination of strategies, that carefully selected active fund managers have the ability to deliver added-value over the long run while keeping a full exposure and constant asset allocation within the following risk-profiles.
More detailed reporting including portfolio quantitative and qualitative data are available to customers having subscribed to the WS Partners Model Portfolio Services. Would you request more information on this service, please do not hesitate to contact us.
Key Characteristics
Portfolios Structure
- Portfolios are made up of 14 to 17 Ucits or Alternative Ucits funds (according to profile).
- We have started two currency based family of portfolios ; in US dollar and in Euro. Swiss Francs will follow shortly
- Apart one fund with a bi-monthly liquidity, all funds have a daily liquidity.
- Usually we select the same funds for USD or EUR portfolios, unhedged for equity strategies and hedged for fixed income ones.
- The performances are shown net of fees, using the institutional share classes, making these Model Portfolios fully replicable.
Strategic Allocations
We keep a constant balance between equity and fixed income strategies according to the Model Portfolios profiles and guidelines. We also maintain a neutral currency and regional allocation versus benchmarks.
Portfolios outperformance should mainly arise from the alpha generated by the active management. Tactical bets such as investment style (value, growth defensive), sector allocation (e.g., commodities, real estate), interest or spread duration might also contribute time to time to the value added generation.
Yield & Income Portfolio
A conservative portfolio with a 1/3 equity and 2/3 fixed income allocation.
Within the equity universe we tend to favour yielding strategies rather than pure price appreciation funds.
The objective is to outperform over time a benchmark composed by 1/3 of the MSCI All Country World Index, and by 2/3 of the Barclays Global Aggregate Bond Index.
Balanced Portfolio
The portfolio aims to outperform a benchmark made of 50% MSCI All Country World Index, and 50% Barclays Global Aggregate Bond Index in a risk-adjusted return basis and with a capital preservation mindset.
For that reason, the portfolio can be invested up to 33% in Absolute Return strategies, including Alternative Ucits funds.
Growth Portfolio
The most equity oriented portfolio with an objective to beat a benchmark composed by 2/3 of the MSCI All Country World Index and 1/3 of the Barclays Global Aggregate Bond Index. Growth of capital through capital appreciation is the main long term portfolio objective.
Review and Outlook – June 2017
Many leading central bank figures adopted more hawkish tones in June, reflecting the potential for policy to be normalised in the latter stages of the year. The yield on 10-year gilts jumped from 1% to 1.3% by month-end, while the 10years Treasuries yield rose from 2.2% to 2.3%, and that on bunds from 0.3% to 0.5%.
While investment grade credit spreads continued to tighten, the magnitude of the rise in gilt and bund yields meant that sterling and euro investment grade credit generally lost ground meanwhile. Financials generally outperformed industrials across developed markets.
In the emerging bond markets, local currency-denominated sovereigns, delivered the best returns with a gain of 0.5%. In contrast, hard currency-denominated government debt, declined by 0.1%.
Equity markets saw some return dispersion in June. UK and European equity markets lost ground, while US shares were broadly flat. Meanwhile, emerging stock markets performance was highly variable, with Russian and Brazilian equities down, while Taiwanese equities were up. US banking stocks gained, while technology shares fell.
In Equity, the MSCI All Country World index gained +0.38% during the month. Year-to-Date, the equity index is up by +10.7%. In Fixed Income, the Barclays Global Aggregate index declined by -0.28% for the month and is up +1.43% Year-to-Date.
Outlook
We keep our risk-on mood which are expressed through:
- An overweight in spread duration for all profile
- A slight overweight in Emerging Markets both FI and Equities
- A value bias for the Growth and Balanced portfolios
Performance Review – June 2017
Since inception, the three Portfolio Models continue to stay well above their respective benchmarks. After stagnating over the past months, the excess return of the Balanced Portfolio has resumed in June. Most of the outperformance generated since inception comes from active management and the skill of our selected Portfolio Managers.
We are pleased to observe that once again most of the portfolios’ outperformance in June came from the alpha generated by the selected fund managers.
Among the 28 funds we have in the different Model Portfolios, 18 funds (64%) had an excess return versus their respective benchmarks.
Our Portfolio Models (in USD) recorded solid results in relative as well as in absolute terms in June. All portfolios bet their respective benchmarks and posted positive returns for the month.
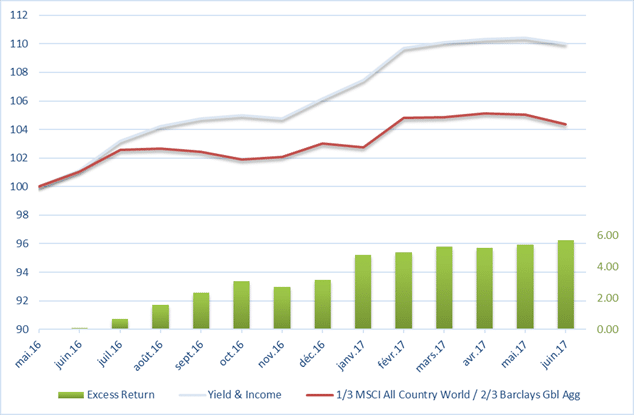
Yield & Income Portfolio (USD)
The portfolio outperformed its benchmark by 25bps in June (+0.19% vs -0.06%), by 253bps YTD and by 591bps since inception (June 2016).
The positioning of the portfolio had a mixed effect. While it benefited from its low duration and spread sensitivity, the growth defensive bias of the equity allocation was a detractor.
Active management was once again a positive element, contributing by 22bps.
From the 15 funds, 9 of them outperformed their benchmarks.
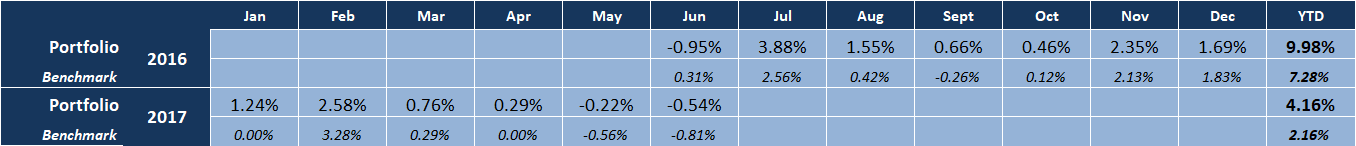
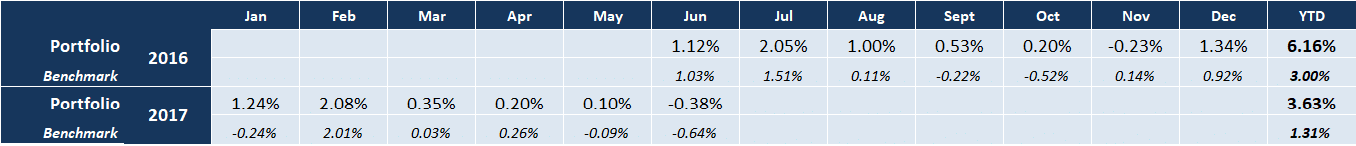
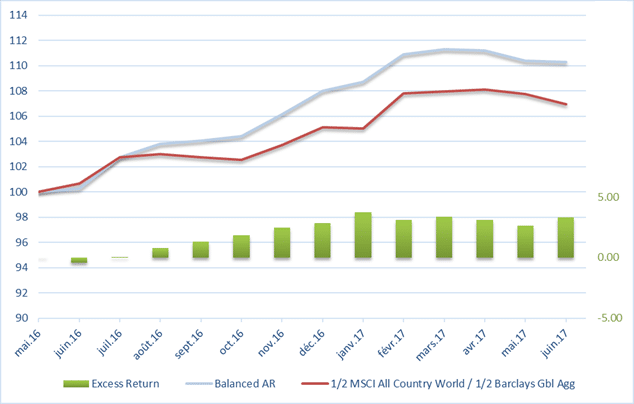
Balanced Portfolio
The Balanced Portfolio generated its best relative performance in June. The short duration in FI as well as the value bias in equity contributed positively, as well as the alpha generated by the asset managers (+49bps).
The Absolute Return pocket contributed nicely by adding 33bps to the portfolio’s outperformance. This pocket serves as an insurance premium to protect the portfolio’s return during weak market conditions. It has well played its role during a mixed month for risky assets.
11 funds outperformed their index for 6 funds lagging theirs.
The Balanced Absolute Return Portfolio was therefore ahead of its benchmark by 57bps, increasing its outperformance to 4bps YTD, and to 336bps since inception.
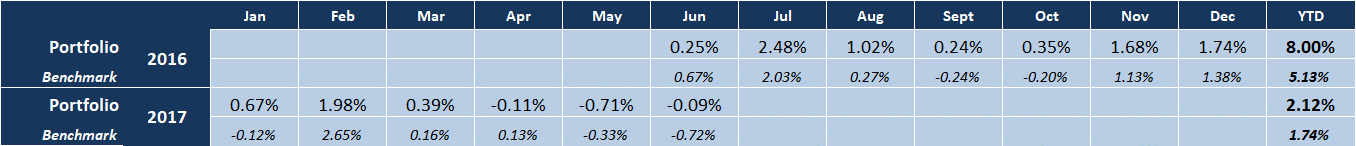
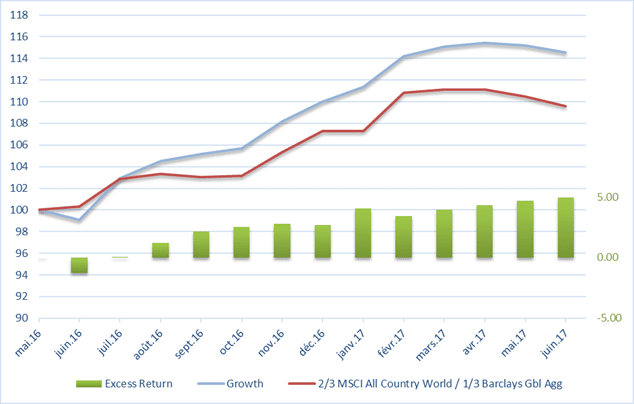
Growth Portfolio
The Growth portfolio generated an outperformance of 27bps in June.
It benefited from the same style bias as the Balanced portfolio. The alpha was again the biggest contributing factor for outperformance (21bps with 8 funds out of 15 funds beating their benchmarks).
The performance of the Growth Portfolio remains strong in every time horizon. Actually, the portfolio had a return of +0.46% in June (+27bps relative to the benchmark), +9.99% YTD (+204bps) and +17.07% (+502bps) since inception.
US Dollar Portfolios
US Dollar – Yield and Income Portfolio
Cumulative Performance to end June 2017

Calendar Return

Benchmark: 1/3 MSCI All Country World Index + 2/3 Barclays Glbl Agg
Source: WS Partners, Morningstar
US Dollar – Balanced Portfolio
Cumulative Performance to end June 2017
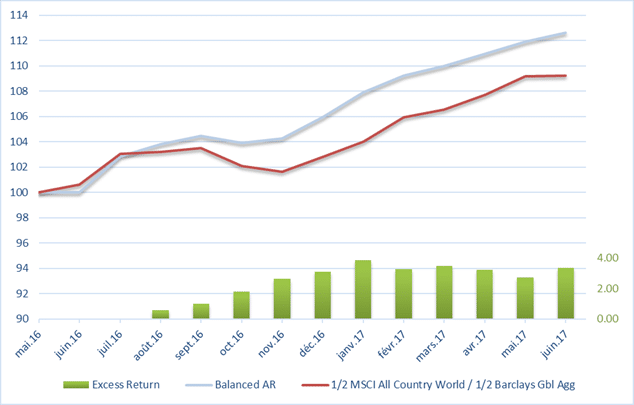
Calendar Returns

Benchmark: 1/2 MSCI All Country World Index + 1/2 Barclays Glbl Agg
Source: WS Partners, Morningstar
US Dollar – Growth Portfolio
Cumulative Performance to end June 2017

Calendar Returns
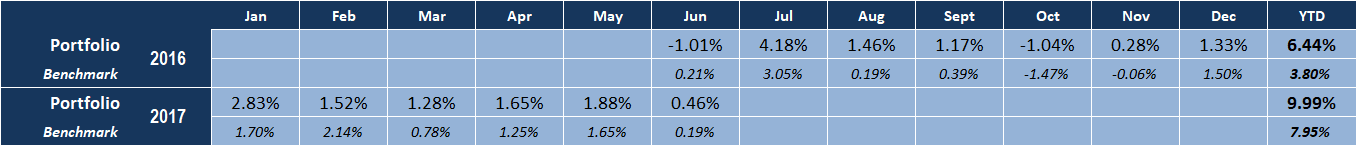
Benchmark: 2/3 MSCI All Country World Index + 1/3 Barclays Glbl Agg
Source: WS Partners, Morningstar
Euro Portfolios
Euro – Yield and Income Portfolio
Cumulative Performance to end June 2017
Calendar Returns
Benchmark: 1/3 MSCI All Country World Index + 2/3 Barclays Glbl Agg
Source: WS Partners, Morningstar
Euro – Balanced Portfolio
Cumulative Performance to end June 2017
Calendar Returns
Benchmark: 1/2 MSCI All Country World Index + 1/2 Barclays Glbl Agg
Source: WS Partners, Morningstar
Euro- Growth Portfolio
Cumulative Performance to end June 2017
Calendar Returns