Is the High Yield Credit Market attractively valued?
Challenging environment for fixed income investors
Financial market returns thus far in 2022 have been extremely challenged on account of geopolitical tensions coupled with elevated inflationary pressures and hawkish central bank activity.
Most markets have delivered material negative returns, with emerging markets and longer duration investment grade bond markets coming under considerable pressure.
Floating rate assets such as the senior loans have been more resilient (-3.7% for the Credit Suisse Global Loan Index in USD as of 31.10.2022)
Figure 1: Total returns YTD
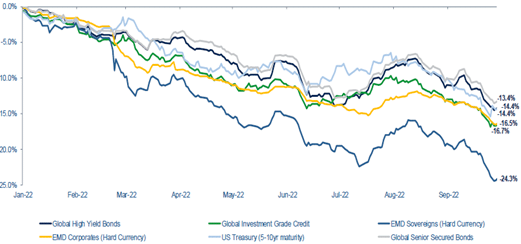
Source: ICE BofA Non-Financial Developed Markets High Yield Constrained Index, JPM CEMBI BD Index, ICE BofA Global Corporate Index, JPM U.S. Government Bond Index, JPM EMBI GD Index and ICE BofA BB-B Global High Yield Secured Bond Index. As of September 30, 2022. Returns in USD hedged terms.
Across global high yield bonds, while both the interest rate sensitivity component (duration) and wider credit spreads have detracted from performance, duration has been a bigger drag on a year-to-date basis.
Figure 2: Returns contribution
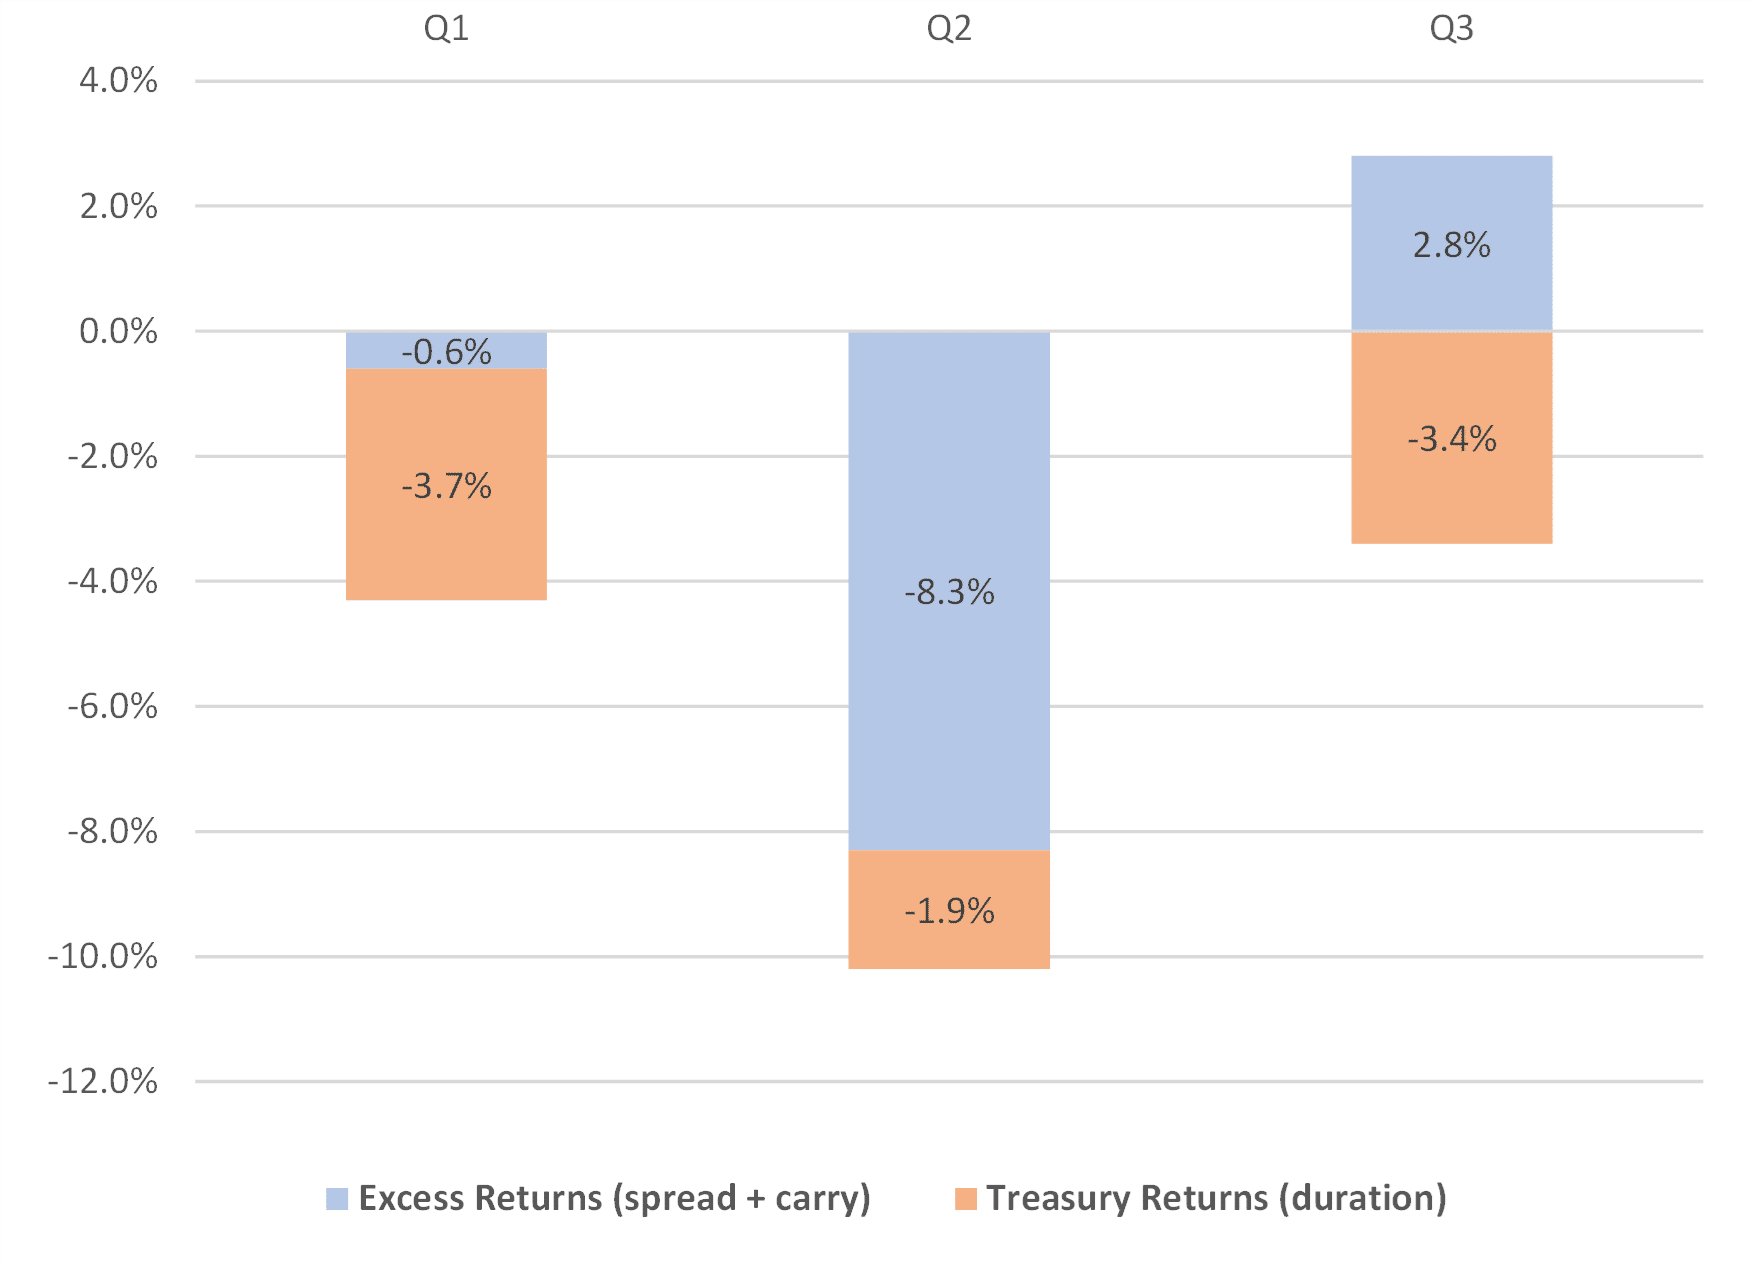
Source: ICE BofA Non-Financial Developed Markets High Yield Constrained Index. As of September 30, 2022
Credit quality and maturity profile
To analyse if high yield bonds are fairly valued, it is necessary first to determine the average quality of the market. Credit quality of the high yield bond market has improved considerably over the past 15 years. It is mainly due to the increase of fallen angels, which have provided opportunities to invest in large, established businesses with operational and financial flexibility..
Figure 3: Credit Breakdown over time
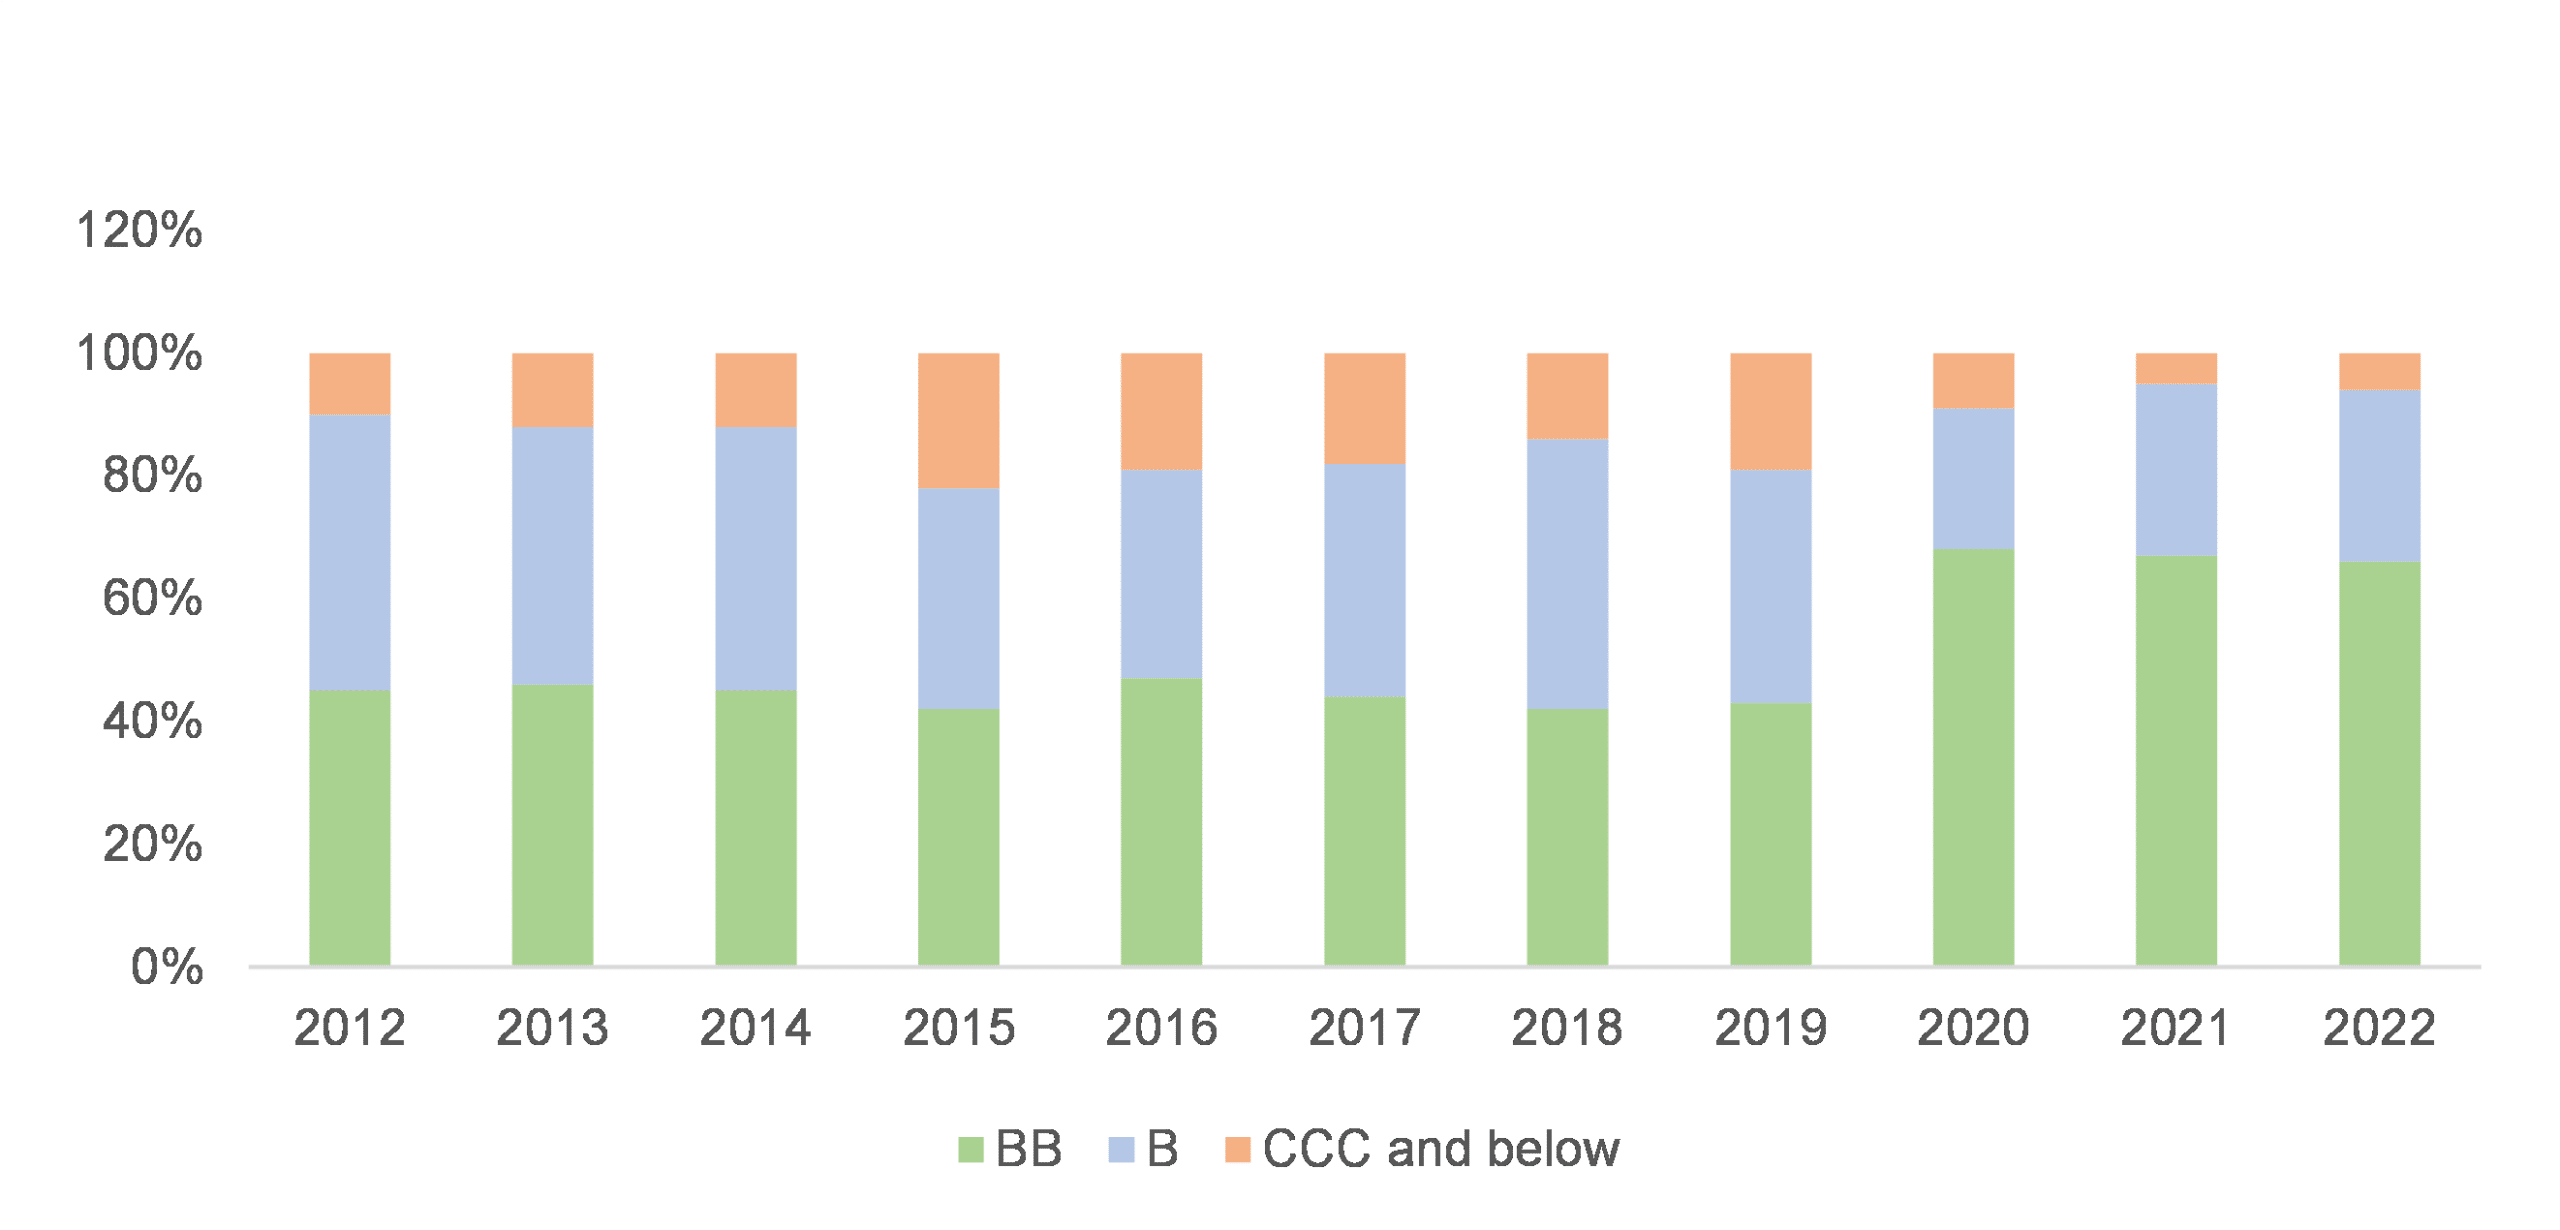
Source: ICE BofA Non-Financial Developed Markets High Yield Constrained Index. As of September 30, 2022
In addition to that, debt maturity windows have been extended considerably because of significant refinancing over the past 2 years, reducing near term liquidity risks.
Figure 4: Global High Yield Bond Market Maturity Profile (%)
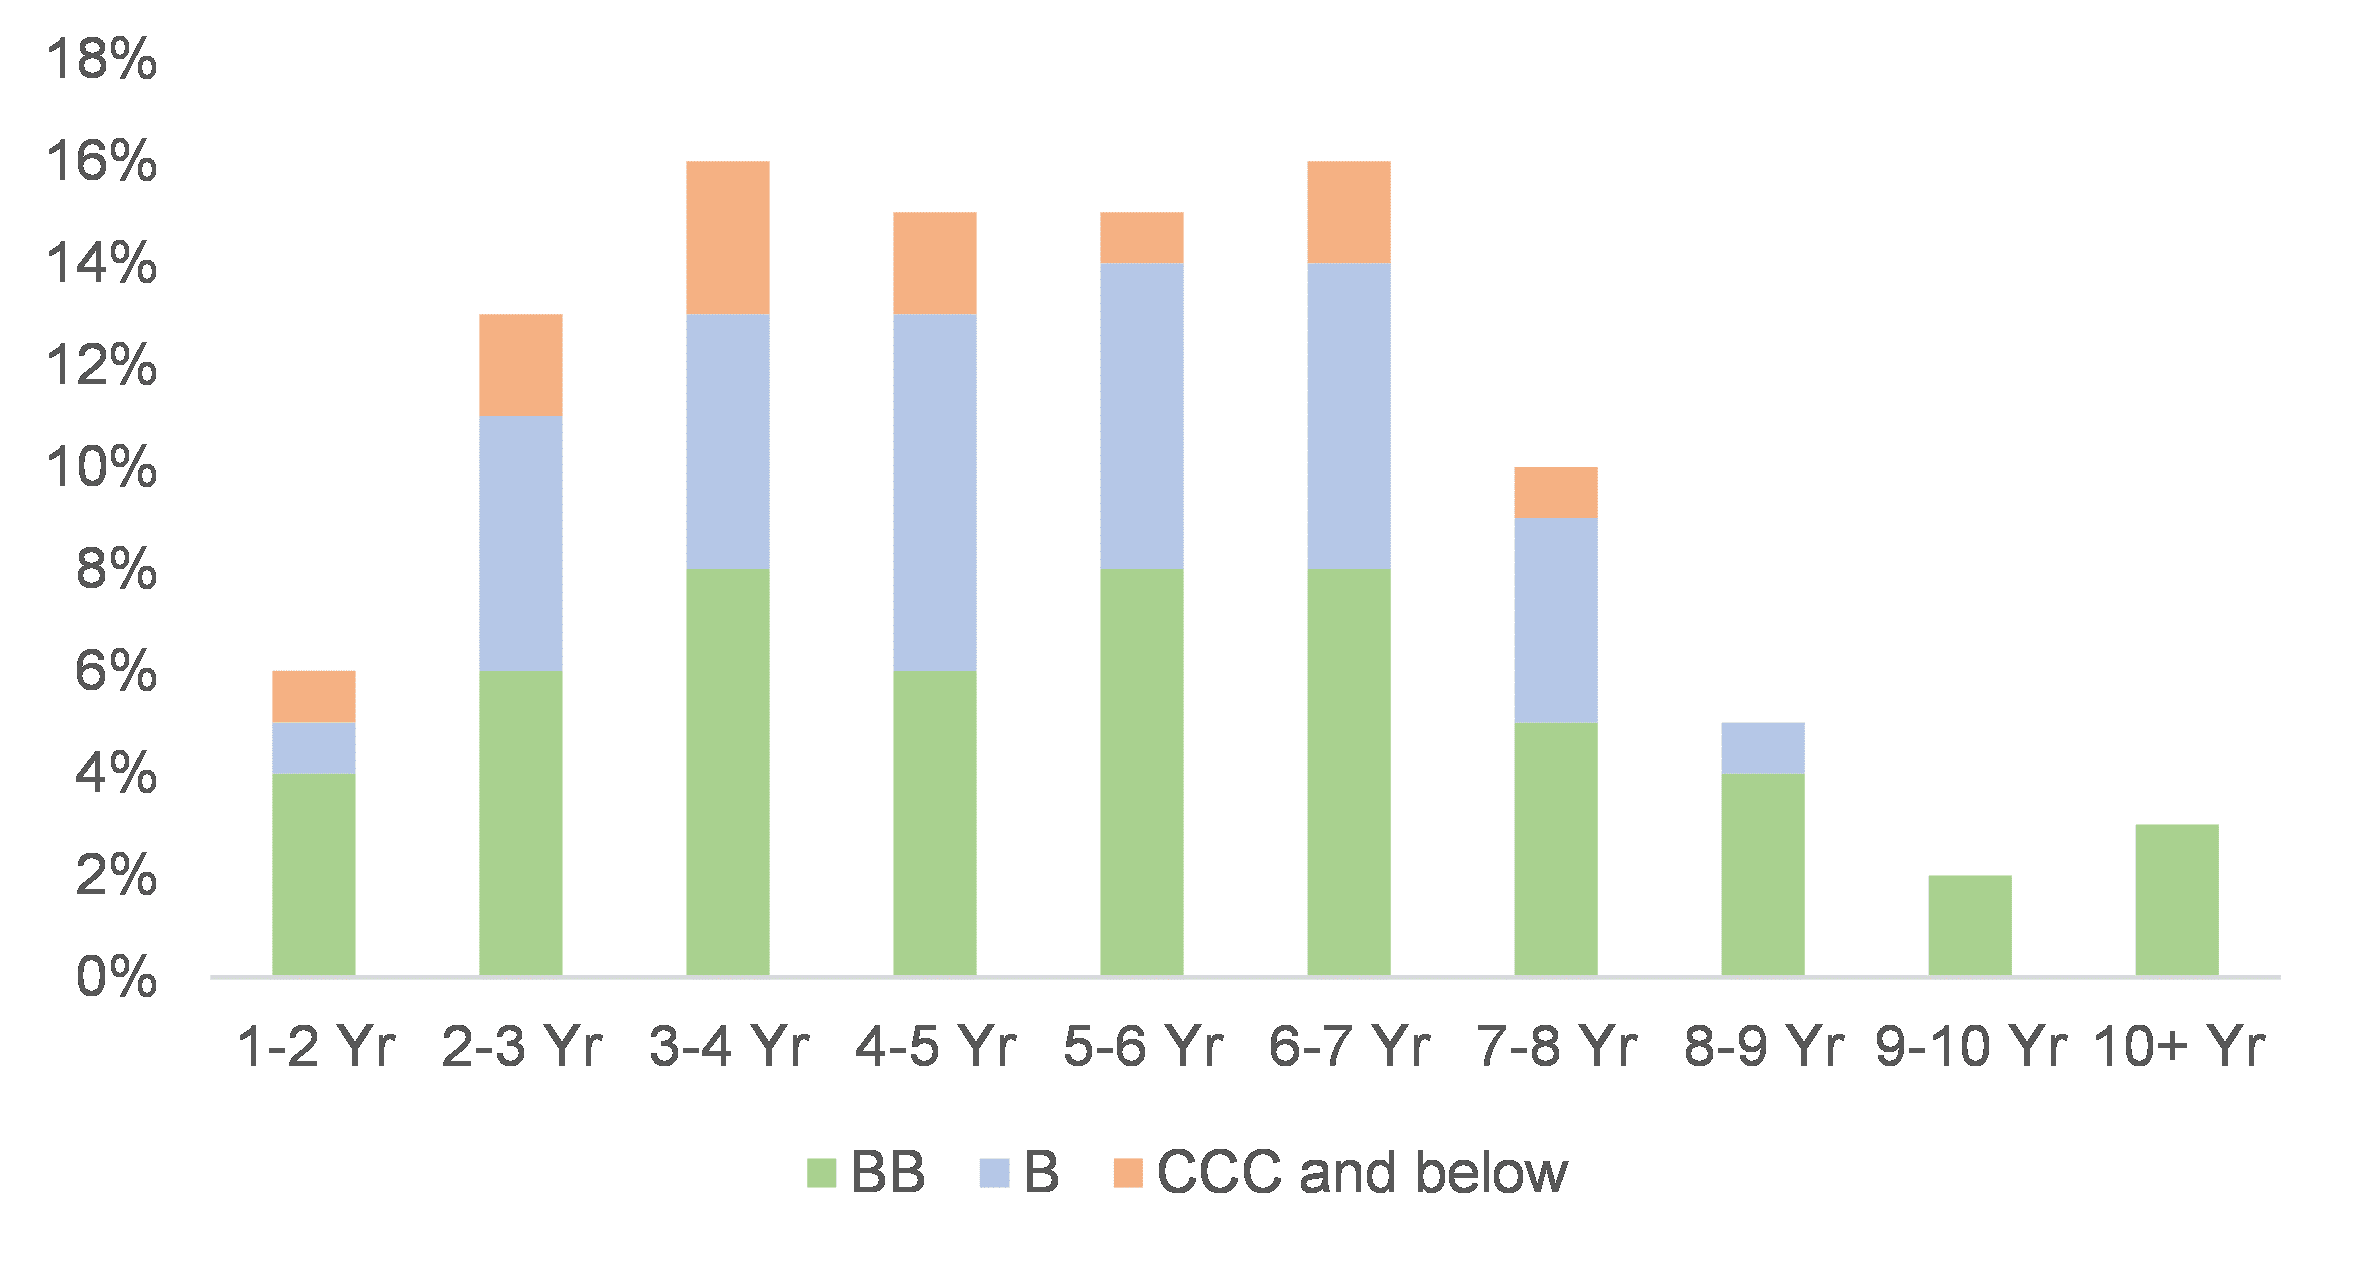
Source: ICE BofA. As of September 30, 2022
The high yield market therefore has currently rather healthy characteristics and seems to be well prepared to face the consequences of a probable recession.
Valuation, don’t confuse discount and distress
At first sight, the very high level of bonds trading at a price below 85 (discounted level) looks like an appealing entry point. However, much of this dislocation has been driven by interest rate sensitivity. Despite the recent up-tick, bonds trading at extremely distressed levels (spreads > 1000bps) has remained relatively contained, especially compared to previous periods of elevated market stress / volatility.
Figure 5: Bonds trading below 85 and OAS spread (%)
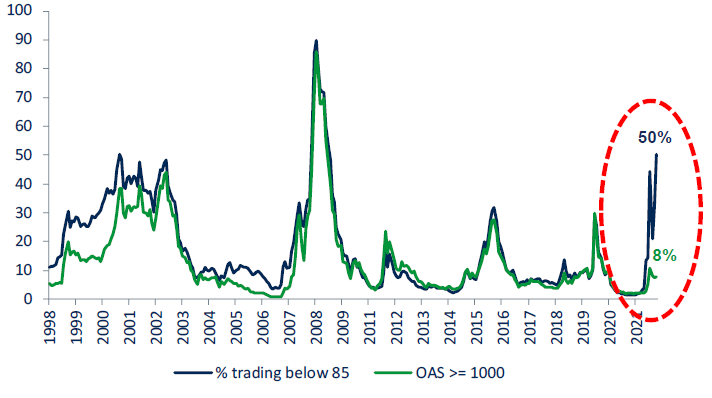
Source: ICE BofA. As of September 30, 2022
What does the market price for the default rate ?
Given the current Yield-to-Worst (10% as of 31.10.2022) the implied default rate priced by the market is over 8% (assuming a 35% recovery rate on average).
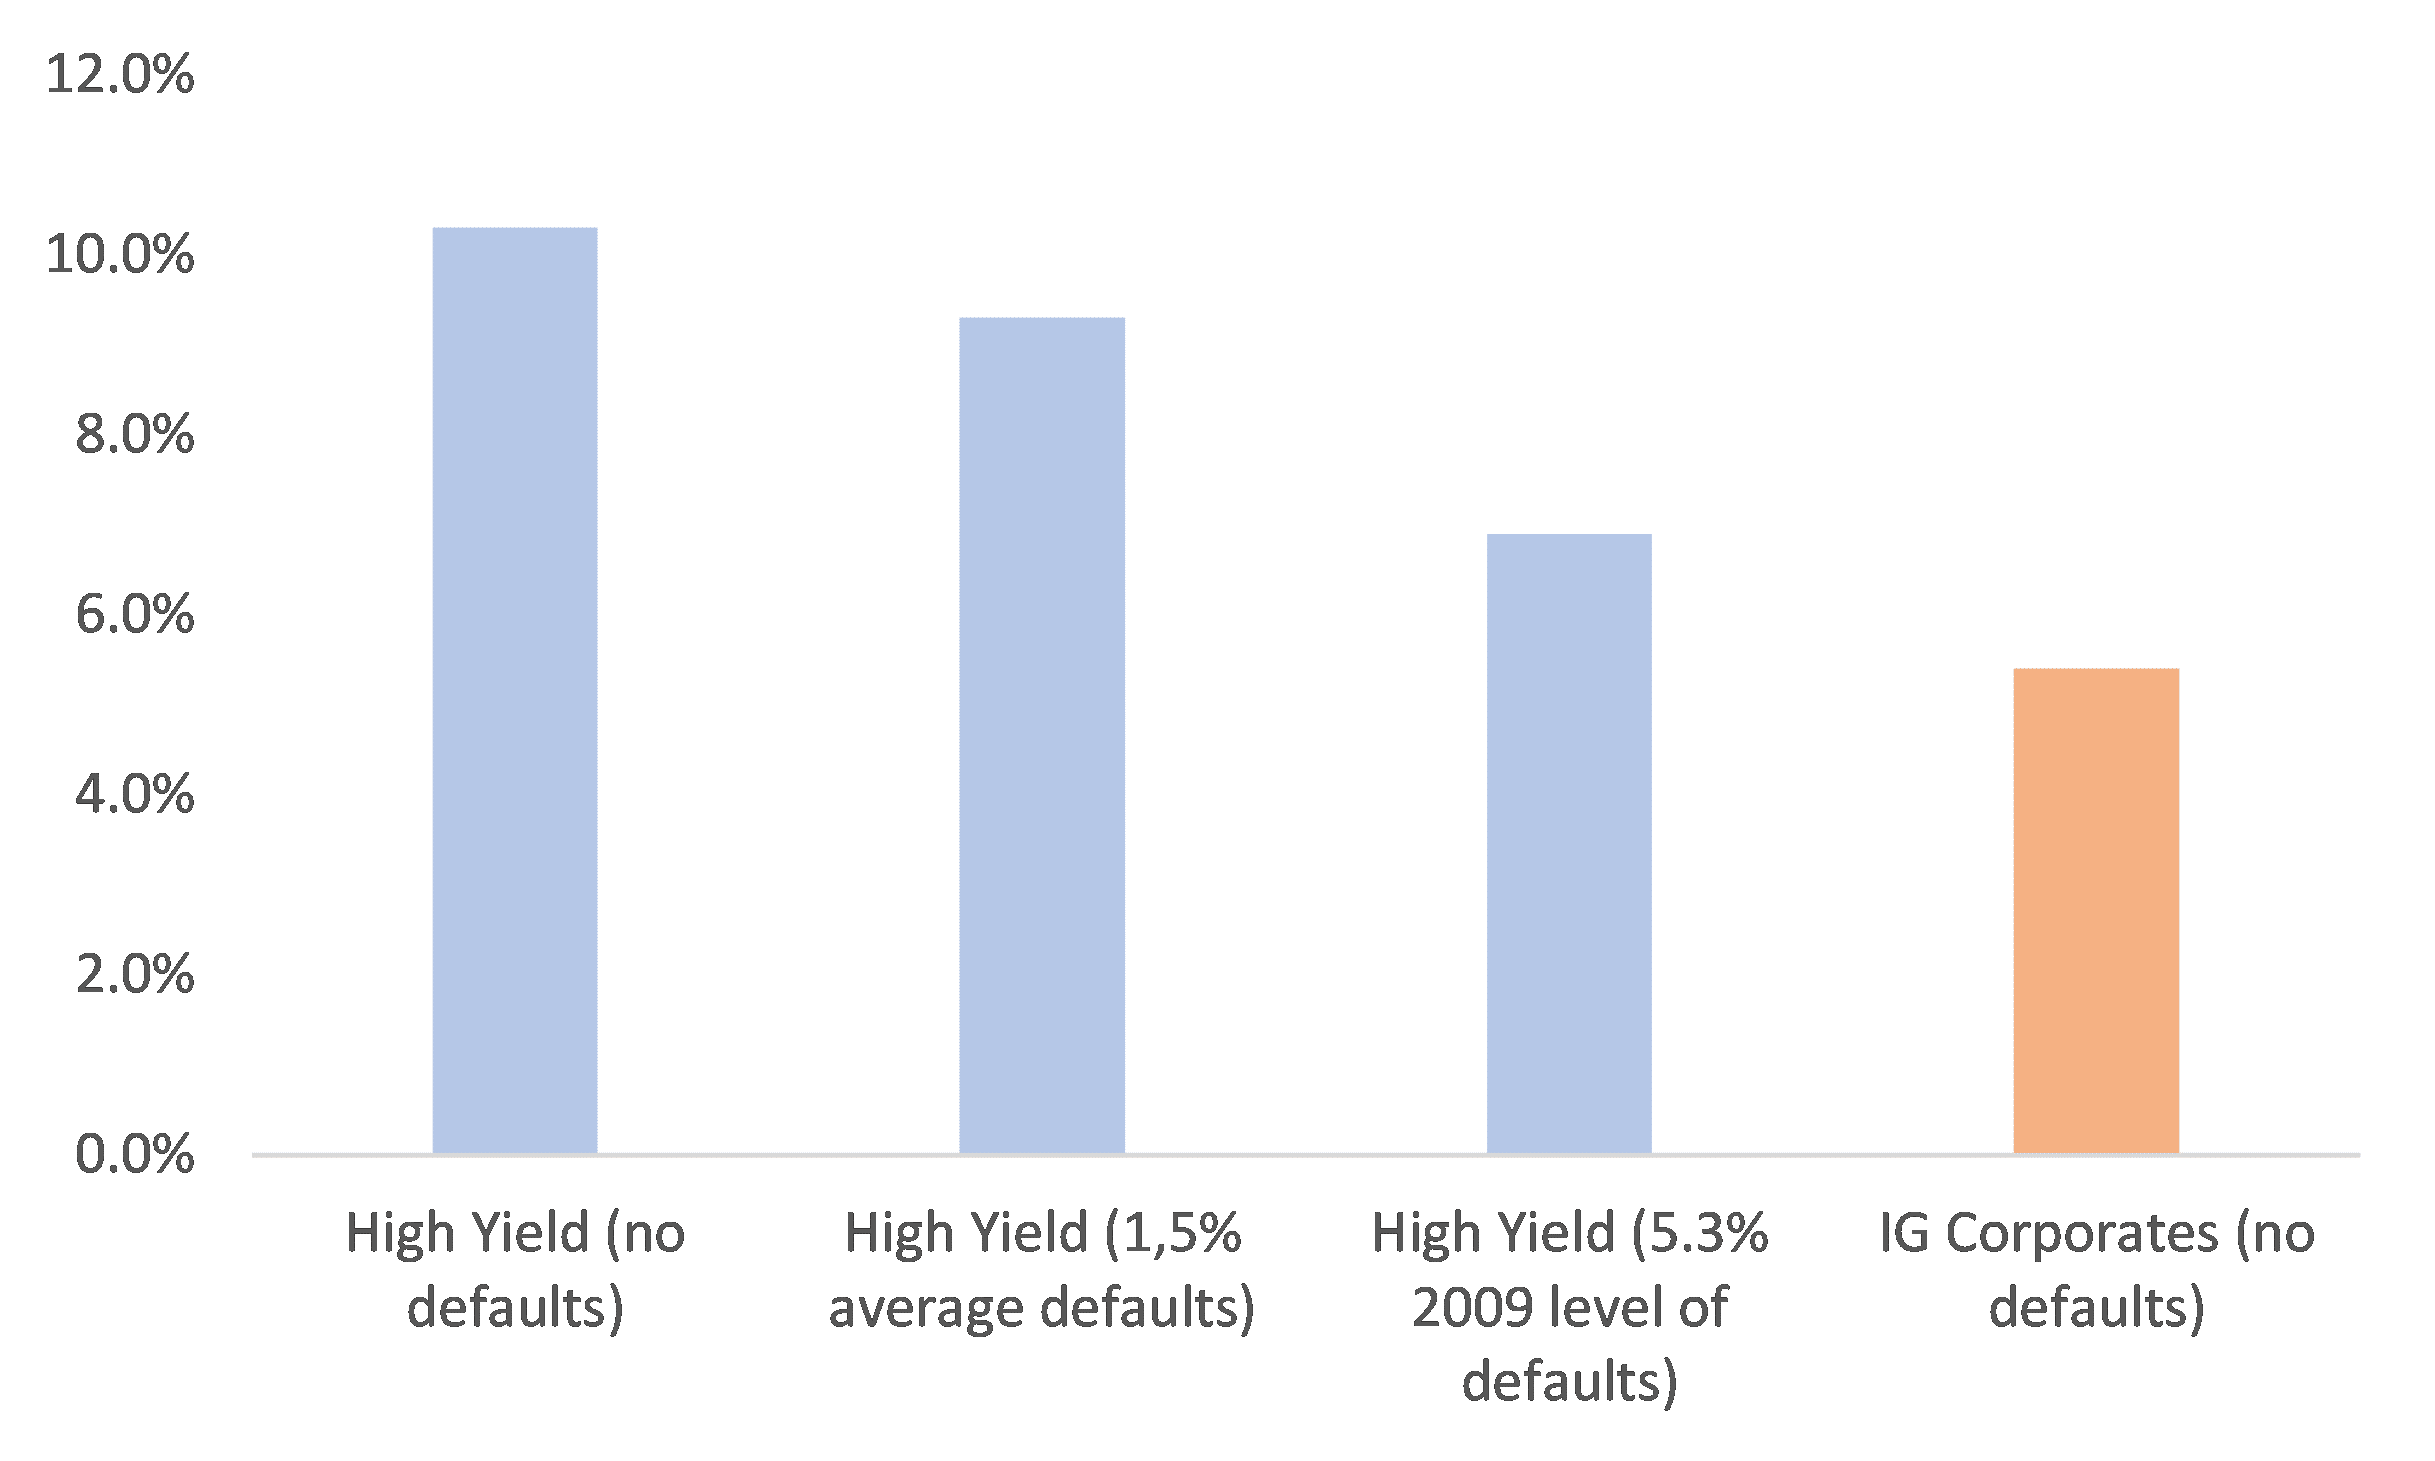
Even once default rates rise to historical averages, high yield would still be expected to deliver a higher net yield than the risk-free rate or the IG Credit.
Figure 6: US High Yield Default Rate historical
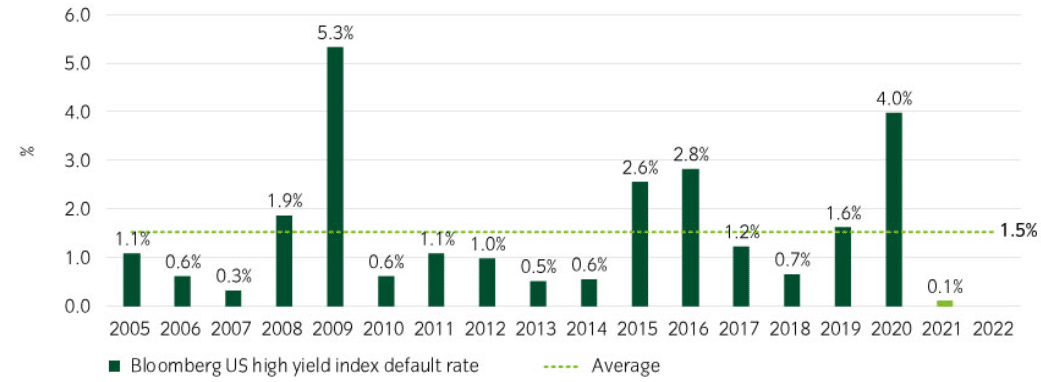
Source: Bloomberg, July 2022, Bloomberg US Corporate High Yield Index
Figure 7: If default rises, Yields by default rate assuming an average recovery rate of 35%
Conclusions
Even though a historically high number of bonds are trading below 85, we have not seen any signs of capitulation in the high yield market. Spread widening has remained relatively narrow so far and the number of bonds valued at distressed level is contained.
The asset class is then not as cheap as it was in 2008 or in March 2020 but from our point of view, it remains relatively attractive as the implied default rate is way above the default pick of 2009 (5,3%) and even the historical average default (1,5%). In addition, the high yield market will enter this phase of rising default rates in relatively good shape and with a safe debt maturity profile.
Credit selection will be quite crucial in this environment, which is why we suggest investing in active strategies. We have selected the Barings Global High Yield fund, as a bottom-up strategy given the depth of their credit research and the portfolio managers deep experience.
They have also been nimble to capitalize on the improved financial ratios of energy-related companies by overweighting this sector at the end of last year / beginning of this year.
We see this fund as a core strategy without alpha bias and able to outperform its benchmark, both in up and down markets as proven by the yearly alpha generated (+0.5% over 3 and 5 years).
Yield-to-Worst(%) |
Modified Duration(Yrs) |
Average Rating |
|
|---|---|---|---|
| Barings Global High Yield Fund | 10.7 | 4.5 | B+ |